In today’s fast-paced digital world, audiences are flooded with information from all directions, social media feeds, websites, and video platforms. Amid this overload, visual content stands out as the most effective way to grab attention and deliver a message quickly.
Among all forms of visual communication, video infographics have emerged as one of the most powerful tools for storytelling and audience engagement.

They combine motion, visuals, and data to transform complex information into easy-to-understand narratives. Whether you’re a marketer, educator, or business owner, learning how to create stunning video infographics can help you connect with your audience more effectively.
Let’s dive into the process and explore key strategies to design compelling visuals that keep viewers hooked.
1. Understand What Makes Video Infographics Effective
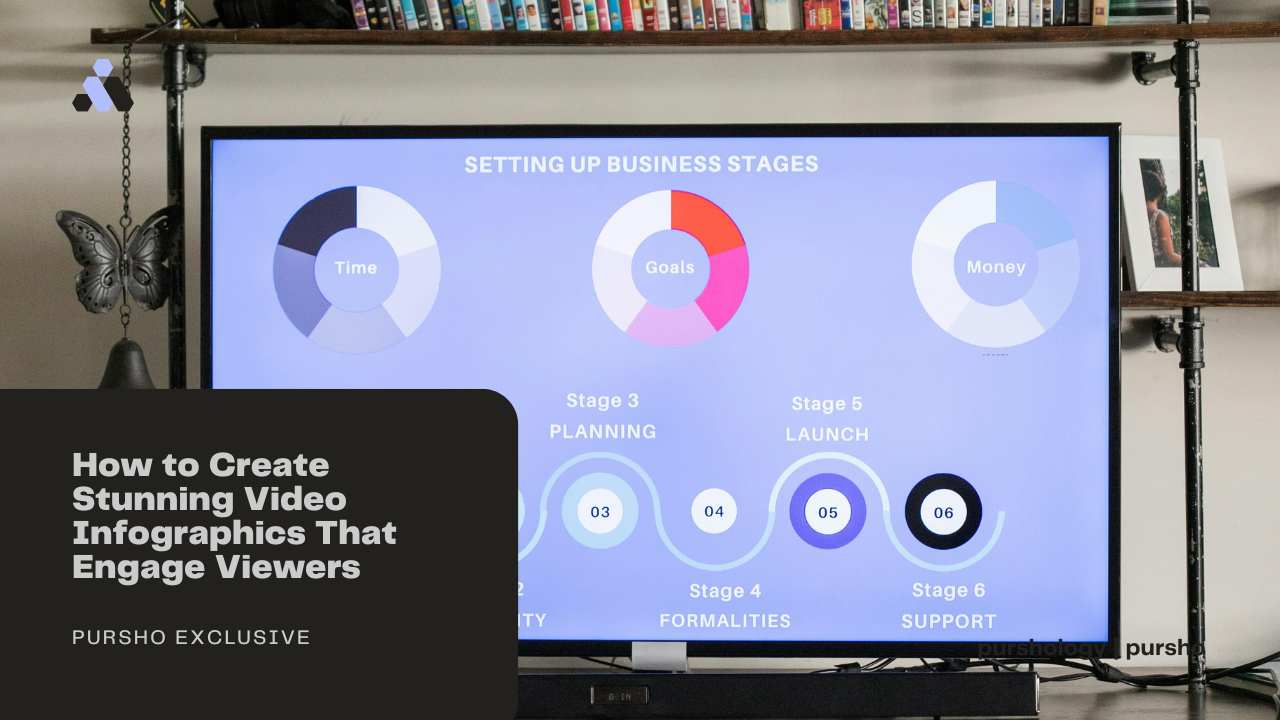
Traditional infographics rely on static visuals-charts, icons, and text to convey data. Video infographics, however, take this concept to the next level by adding motion, voice, and sound.
This dynamic combination not only captures attention but also improves message retention.
People process visual information 60,000 times faster than text, and videos increase engagement by up to 80% compared to still images.
By merging the storytelling power of animation with informative visuals, you create a medium that educates, entertains, and inspires all at once.
2. Define Your Purpose and Audience
Before you start designing, clearly define what you want to achieve. Are you explaining a concept, promoting a product, or sharing research data?
The purpose determines the structure, tone, and design of your video.
Next, identify your audience. A video infographic for university students will look very different from one made for corporate executives.
Understanding your viewers’ interests, age, and level of expertise helps you select the right visuals, pacing, and language.
For instance, if your target is business professionals, focus on clean graphics, minimal text, and a formal tone.
But if your audience is young or general consumers, add vibrant colors, quick transitions, and relatable characters to keep things fun and approachable.
3. Gather and Simplify Your Data
The heart of every infographic video or static is accurate data. Start by collecting reliable information from credible sources.
However, resist the urge to overload your audience with numbers. Your goal is to simplify, not to overwhelm.
Choose the most relevant statistics and trends that support your message. Then, break them down into digestible chunks. Ask yourself:
- What’s the main takeaway I want viewers to remember?
- Can I present this idea in a single visual or short animation?
Simplicity leads to clarity. If your viewers can grasp your message within the first few seconds, your video infographics are doing their job.
4. Create a Strong Script and Storyboard
Even the most beautiful visuals won’t make an impact without a clear narrative. Start with a script that outlines the flow of information. Divide your message into three main sections:
- Introduction: Hook your viewers with an interesting question, fact, or problem.
- Body: Present your data, explain the process, or share insights in a logical order.
- Conclusion: End with a summary, call to action, or memorable message.
Once the script is ready, move on to storyboarding. A storyboard is a visual sketch of your scenes. It helps you map out how each piece of data will appear, which transitions to use, and where animations will occur.
Storyboarding ensures that your video infographics flow smoothly and maintain a consistent rhythm.
5. Design Visually Appealing Graphics
Design plays a crucial role in how well your audience understands and remembers your content.
Here are some tips for effective visual design:
- Use a cohesive color palette: Stick to 2-3 primary colors that reflect your brand or message.
- Choose readable fonts: Sans-serif fonts like Helvetica or Open Sans work well for screen readability.
- Incorporate icons and symbols: Visual metaphors make abstract concepts easier to grasp.
- Maintain balance and spacing: Avoid clutter by leaving enough white space around elements.
When creating video infographics, motion is your advantage. Use subtle animations like sliding charts, fading icons, or moving arrows to draw attention to key points.
The goal is to guide the viewer’s eyes, not to distract them with excessive effects.
6. Add Voiceover and Sound Design
Sound is the emotional layer of your video. A good voiceover adds personality and helps viewers connect with your content.
Choose a tone that matches your audience professional, conversational, or friendly.
Additionally, background music and sound effects can enhance the mood and emphasize important transitions.
For example, a soft whoosh when a chart appears or a gentle click sound when highlighting numbers can make your video infographics feel more interactive and engaging.
However, be careful not to overpower the visuals with loud or distracting sounds. The narration and visuals should always remain the focus.
7. Use the Right Tools and Software
You don’t need to be a professional animator to create quality video infographics. There are plenty of tools that make the process easier:
- Canva Video and Animaker – Great for beginners with drag-and-drop templates.
- Adobe After Effects – Ideal for advanced users who want full creative control.
- Piktochart and Visme – Offer built-in infographic templates that can be animated.
- Powtoon and Biteable – Perfect for quick and professional-looking animated presentations.
These platforms provide pre-designed assets, icons, and transitions that help you create impressive video infographics without needing deep technical skills.
8. Keep It Short and Focused
Attention spans online are shorter than ever. The ideal length for video infographics is usually between 60 and 90 seconds. Anything longer risks losing your audience.
Stick to one main idea per video. If you have multiple topics, create a series instead of packing everything into one clip.
A short, focused video delivers a stronger impact and increases the chances of being shared.
9. Optimize for Multiple Platforms
Once your video infographic is ready, think about distribution. Each platform has different requirements:
- Instagram and TikTok: Vertical or square videos under 60 seconds.
- YouTube: Horizontal videos with detailed storytelling.
- LinkedIn and Facebook: Informational clips that work well with captions.
Always include subtitles since many users watch videos without sound. Also, use relevant keywords and hashtags to make your video infographics more discoverable on search engines and social platforms.
10. Measure and Improve
After publishing, monitor how your video performs. Track key metrics like views, watch time, engagement rate, and shares.
Tools like YouTube Analytics or Google Analytics can show how long viewers stayed and where they dropped off.
Use this feedback to improve future videos. If you notice viewers stop watching after 30 seconds, try tightening your intro or simplifying your visuals.
Consistent improvement turns your video infographics strategy into a long-term success.
Final Thoughts
Creating stunning video infographics isn’t just about design, it’s about telling a story that resonates. When done right, they simplify complex ideas, boost engagement, and make your brand more memorable.
By understanding your audience, crafting a clear script, and combining visuals with motion and sound, you can transform data into a captivating visual experience.
Start small, experiment with tools, and refine your style over time. In a world overflowing with content, video infographics are your key to standing out, connecting deeply, and keeping your message alive in the minds of viewers.


