
5 Best Travel Insurance Cancellation Letters for Work Reasons (Free Samples)

Freelance UI/UX designers can find steady, high-paying startup clients by combining platforms like Upwork, Toptal, Fiverr Pro, LinkedIn, Wellfound, and...

AI image tools are easy to praise when the task is simple. Give them one dramatic prompt, pick the best output, and the product can look extraordinary....
Discover the top 5 free icon packs for web developers and designers in 2026, each offering unique styles, extensive libraries, and seamless integration....
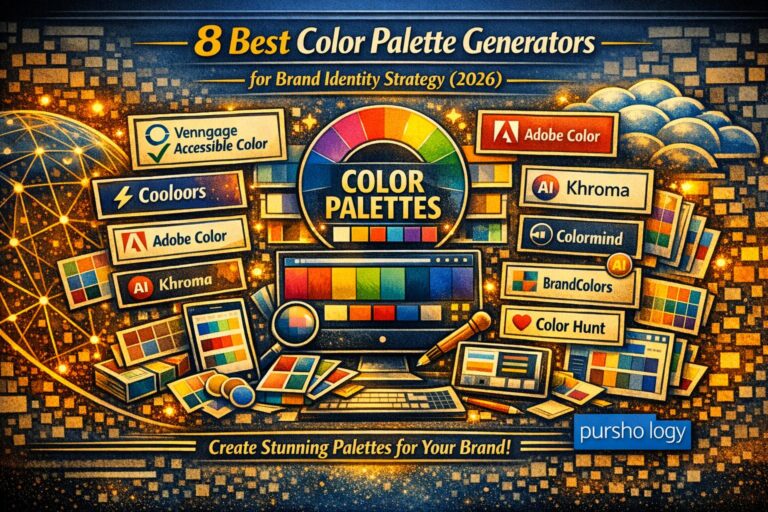
Discover the top 8 color palette generators essential for crafting a compelling brand identity in 2026. This guide highlights each tool’s unique features,...
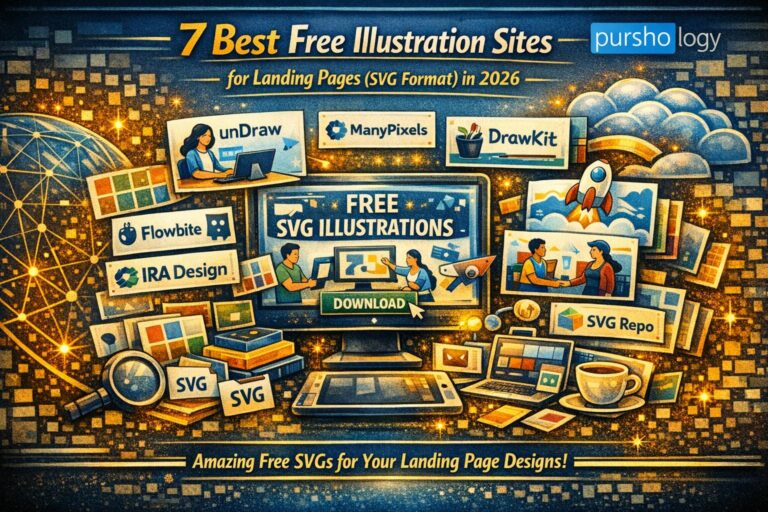
Discover the top 7 free illustration sites offering high-quality SVGs perfect for landing pages in 2026. This guide highlights each platform’s unique...
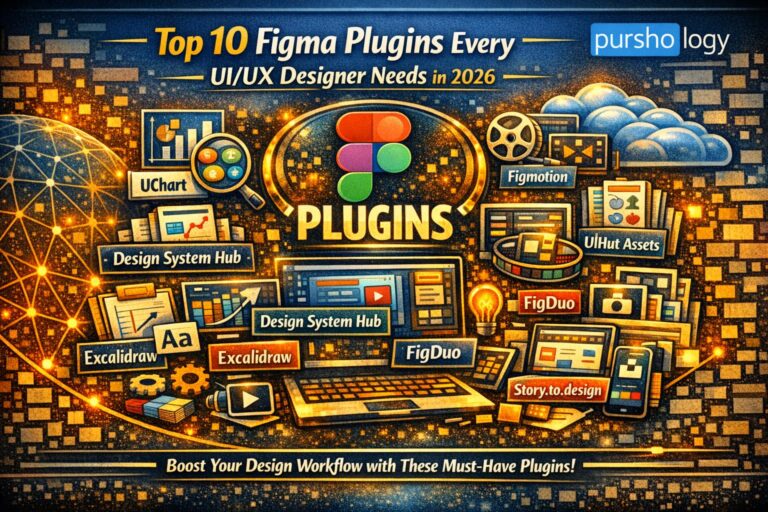
Discover the top 10 essential Figma plugins for UI/UX designers in 2026 that revolutionize workflow efficiency and creativity. This post highlights plugins...

by Adam Noar
Wouldn’t it be nice if you looked out into your audience and saw smiling faces instead...
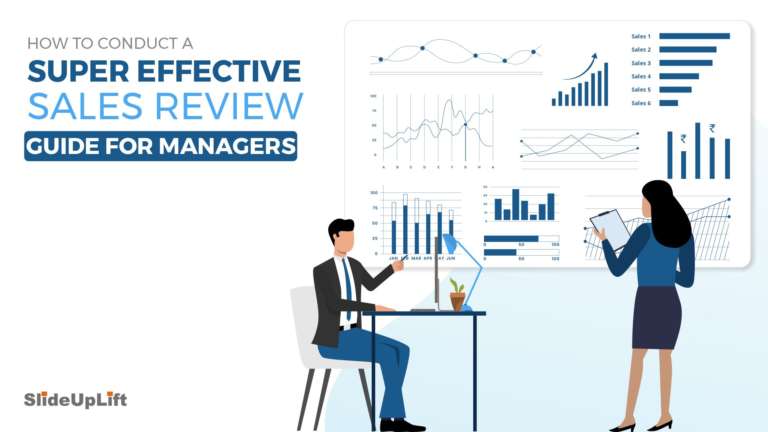
Sales is a challenging job. As a Sales Leader, it can become even more challenging since the job definition...
In business school, you will espy classmates who demonstrate a pathology of unpreparedness – they “wing...

As a speaker, you make every effort to make your presentation stand out – you add high-resolution images,...
The start of the year is usually a highly busy period for a business as it draws the line to review what...