
Gantt charts have been around for more than 100 years, but these visual project management tools are still among the best ways to manage deadlines, keeping them on time and on budget.

Project managers have options. There are plenty of tools and project management philosophies to choose from.
Gantt charts are among the best for timebound projects. The development team at an ecommerce company might use a Gantt chart in conjunction with other tools to manage a platform migration. Or the operations team at an omnichannel retail enterprise might use a Gantt chart to open a new warehouse or update an existing one.
Gantt charts tend to work best when a project has a clear end, rather than ongoing.
Critical Path
Gantt charts prioritize what tasks must be completed when. The charts show when tasks must be completed and the sequence of lesser tasks that are critical because of their dependencies, complexities, and timing.
This critical path is not a list or series of the most important tasks, but the longest sequence of tasks, the things that will take the most time to complete. A critical path may include some rather mundane items, but they are critical because of when they must be completed, how long they will take, and the order in which they must be done.
Network Diagram
Some managers will use something like a network diagram to define the critical path for a project before building a Gantt chart.
This diagram can even be made with notecards by writing each major task on a card along with an estimate of how long that task will take to complete in hours.
Then arrange the cards based on the dependencies and relationships of tasks, noting when they must be done in some order. The aim is to identify the sequence of tasks that will take the longest time to complete.

The author has begun to arrange note cards into something resembling a network diagram as part of a web development project.
This same process can be done with project management software.
Adding the Critical Path
Once it has been identified, a critical path can be added to the Gantt chart. This might be done with project management software or in a spreadsheet.
In the spreadsheet format, one would expect to find a list of tasks in the far left column. Dates, which can be captured in days, weeks, or months depending on the project, are often in the first or second row. Each cell should include the number of hours required for a project for a given week.

The critical path on the Gantt chart is the sequence of tasks that will take the longest to complete. Each of the tasks in the critical path is dependent on the task that comes before it.
Finally, some project managers will keep all critical-path tasks at the top of the spreadsheet and color the cells in red. Completed paths are shaded gray.
Remember, the critical path represents the longest sequence of tasks. Once you have built a critical path, you can estimate how long the total project will take.
Also, remember your resource constraints. Consider whether the folks working on your project can focus 100 percent of their time on the task for the week, or not.
Floating Tasks
In the Gantt chart context, non-critical-path tasks are said to be “floating,” meaning that while vital for the project, they can be fitted into a “floating” window of time.
If a project manager used a network diagram to define a critical path, she probably also identified several tasks that must be done in sequence but which did not add up to as many hours of work as the critical path.
Taking the longest of these secondary sequences first, add them to the Gantt chart.
There are a couple of ways floating tasks are displayed. First, a black vertical line shows the time frame in which a floating task must be completed.
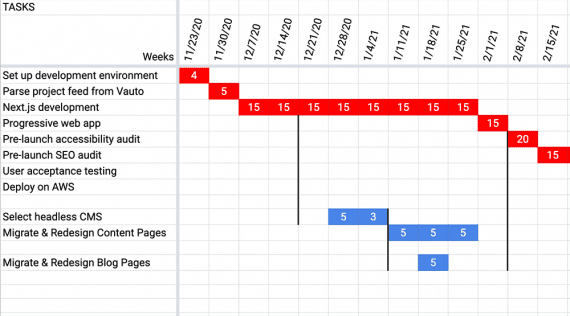
Floating tasks are shown lower than the critical path and between sets of black vertical lines. These lines represent time constraints for the floating tasks.
When developing an ecommerce site, for example, a headless content management system must be completed at a specific point in the process, but the associated work could begin much earlier.
Often, project managers color floating tasks, like critical-path tasks, blue or green, and shade them in gray when completed.
Notice that in a spreadsheet, the project manager can sum a column to determine how many total resource hours the project is consuming in a given week. Floating tasks can be shifted to make better use of available hours.
")
")
")