
A baby’s physical development is determined by a wide range of factors including genetics, nutrition, environment, health condition, and activity level. In this regard, there is a recognized discrepancy in what is considered the ‘normal growth pattern of a baby. These discrepancies often make parents worry and wonder if their babies are bigger or smaller than babies of their same age.

As a way of answering these questions, the baby growth chart was developed.
This is a chart that shows the expected development level of babies at different stages of their early lives.
The first baby growth chart was developed in 1977 by the National Center for Health Statistics (NCHS). In 2000, the Centers for Disease Control and Prevention (CDC) provided updated charts. Similarly, the World Health Organization (WHO) shared the international baby growth rate.
Note That: CDC recommends that parents should use WHO baby growth charts for children under the age of 2 years and use CDC baby growth charts for children above 2 years.
What Do Baby Growth Charts Measure?
These charts are detailed and capture the essential elements that define the growth of a child. A child’s development is assessed using the charts. Healthcare providers use these charts when commenting on the overall health of a baby.
A baby growth chart covers the following:
- Head circumference
- Length/height
- Weight of a baby
The weight of babies differs at birth and as the baby grows and develops. However, WHO states that the average weight of a newborn is between 7 and 7 ½ pounds (3.2 to 3.4 kg). A baby that is born less than 5 pounds 8 ounces (2.5kg) is considered a low birth weight. A baby that is born with more than 8 pounds 13 ounces (4.0 kg) is considered larger than average.
The birth weight of a baby is affected by various factors as highlighted here:
- How many weeks a pregnancy lasts: If a baby is born before the completion of the pregnancy (before the due date), the baby’s weight will be smaller. Contrarily, a baby born after the due date is likely to be larger. This concept is explained simply by the fact that the baby grows during pregnancy.
- Smoking: Smoking has adverse effects on babies’ health. So, when a pregnant mother smokes during pregnancy, the baby born is likely to be smaller.
- Gestational diabetes: Diabetes during pregnancy often results in larger babies.
- Nutritional status: The nutrition of the mother during pregnancy directly affects the growth of the baby. Therefore, a mother with poor nutritional tendencies will lead to the birth of a smaller baby whilst excessive weight gain is likely to lead to larger babies.
- Family history: Sometimes, the family history affects the birth weight of a baby. A baby can be born larger or smaller based on the family history.
- Gender: Baby boys tend to be larger than girls. This is purely based on the average data, and it may vary depending on other factors.
- Multiple pregnancies: It is likely for a baby born alone (single baby) to be larger than babies born in a multiple pregnancy (twins, triplets, quadruplets, etc.)
Weight gain in the first year
After the baby is born, there are expected weight gains to occur. However, these gains are different depending on different babies. However, here are quick weight gain expectations that you can work with in the first year of a baby’s life.
First two weeks
A baby may start losing weight the first few days after both. This is normal for both breastfed and bottle-fed newborns.
On average, a breastfed baby may lose up to 10% while a bottle-fed baby may lose up to 5%.
As the baby finishes the first two weeks, most babies regain their lost weight and weigh nearly the same as their birth weight.
By one month
After a month, a baby has already started developing feeding patterns and is no longer as sleepy as the first few days. These regular feeding patterns developed by infants combined with their improved sucking power can lead to an additional pound over birth weight.
By six months
For the first six months, infants gain about one pound every month. Therefore, the average weight at six months for boys is 17 pounds 8 ounces (7.9 kg) and 16 pounds 2 ounces (7.3 kg) for girls.
By one year
After the sixth month going to the first year, there is a slow weight gain for most babies. At twelve months, the average weight of a boy is 21 pounds 3 ounces (9.6 kg) and 19 pounds 10 ounces (8.9 kg) for girls.
Breastfed infants
Losing weight during the first few days of an infant’s life is quite normal. However, if the baby continues to lose weight or develops poor weight gain signs, then it should signal a problem. If such a baby is being breastfed, it could mean that he/she doesn’t get enough breast milk.
Regarding weight gain, breastfed babies don’t gain weight as fast as formula-fed babies. Breastfeeding reduces excessive weight gain and can also prevent obesity.
However, it is also possible for a breastfed child to gain much weight if there is a constant supply of breast milk from the mother, or if the child starts to intake solid foods early.
Another aspect of a child’s growth is height. On average, a baby grows by about an inch per month for the first six months. This will reduce by about half an inch after six months.
On average, a six-month baby boy measures 26 ½ inches (76.6 cm) while a baby girl measures 25 ¾ inches (65.7 cm). At one year, the expected average height of a baby boy is 29 ¾ inches (75.7 cm) while girls record an average of 29 inches (74 cm).
The length/height of a baby is determined by a set of factors that have either direct or indirect influence on how tall the baby will grow:
- Genetics: The most significant factor that determines the height of a baby is the height of the mother, father, and other family members. The child is likely to get his/her height from within the family.
- Gender: Boys are likely to be taller than girls.
- Nutrition: Nutrition starts right from pregnancy where the mother is expected to partake of proteins, vitamins, and minerals that will boost the health of the baby’s bones for optimal growth.
- Sleep pattern: Studies have revealed that infants gain height after periods of sleeping.
- Physical activity: The muscles and bones of an infant are built well when the infant is engaged in body movement and physical activities.
- Overall health: The health of a baby is important in determining his/her height growth. If a child has chronic illness during childhood, then physical growth can be affected, thus, leading to slow height growth.
This chart highlights the tracking of a child’s growth in height. The average is based on the good health of a child from birth to one year.
| Age | Height of Boys | Height of Girls |
|---|---|---|
| 1 Month | 21 1/2 inches (54.7 cm) | 21 inches (53. 7 cm) |
| 2 Months | 23 inches (58.4 cm) | 22 1/2 inches (57.1 cm) |
| 3 Months | 24 1/4 inches (61.4 cm) | 23 1/2 inches (59.8 cm) |
| 4 Months | 25 1/4 inches (63.9 cm) | 24 1/2 inches (62.1 cm) |
| 5 Months | 26 inches (65.9 cm) | 25 1/4 inches (64.0 cm) |
| 6 Months | 26 1/2 inches (67.6 cm) | 25 3/4 inches (65.7 cm) |
| 7 Months | 27 1/4 inches (69.2 cm) | 26 1/2 inches (67.3 cm) |
| 8 Months | 27 3/4 inches (70.6 cm) | 27 inches (68.7 cm) |
| 9 Months | 28 1/4 inches (72.0 cm) | 27 1/2 inches (70.1 cm) |
| 10 Months | 28 3/4 inches (73.3 cm) | 28 inches (71.5 cm) |
| 11 Months | 29 1/4 inches (74.5 cm) | 28 1/2 inches (72.8 cm) |
| 12 Months | 29 3/4 inches (75.7 cm) | 29 inches (74.0 cm) |
Note: all inches are rounded to the nearest quarter of an inch.
How to Read the Growth Charts
When you visit your healthcare provider, you will be guided on how to understand the growth of your child. Here is a quick look into the process of reading growth charts. We will explore the four growth charts that you will be presented with when visiting your healthcare provider.
Head circumference chart
The head circumference chart has the X-axis (the horizontal line) and the Y-axis (the vertical line). In the chart, X-axis represents the number of months, and the Y-axis has the variable that you are measuring, which in this case is the head circumference measurements.
All you have to do is to follow the X-axis and Y-axis until they intersect. They will likely intersect at a curved line, which you should follow up to the end and you will be able to see the percentile of your baby.
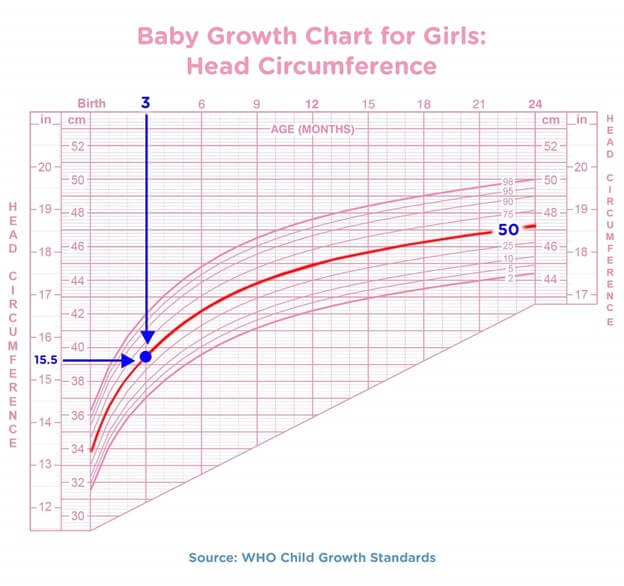
In the example provided above for a 3-year-old girl, the head circumference is 15.5 inches. Following the curved line, it is clear that the child falls in the 50th percentile, which means that half of all 3-year-old girls have smaller heads while the remaining half has bigger heads.
Weight-for-length chart
At the bottom of the grid (X-axis), you can find the length of your child in centimeters or inches. Your child’s weight can be found on the left side of the grid (Y-axis). After you have located the two, you should follow the Y-axis and X-axis until they meet the growth curve, which you should follow to the end to find the percentile in which your baby is in.
Check out this chart for a boy’s weight-for-length:
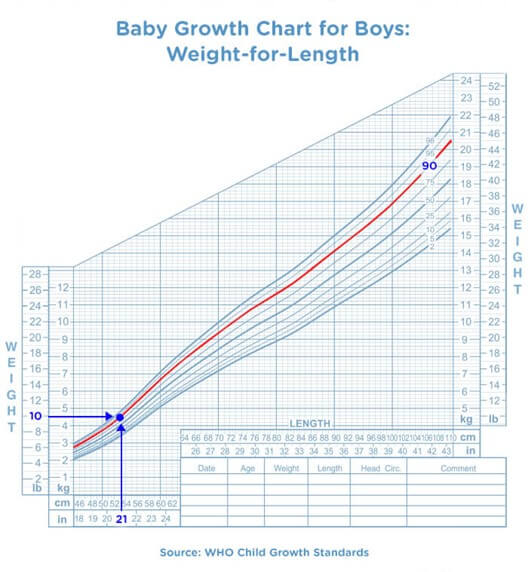
In this example, the boy weighs 10 pounds and has a height of 21 inches. The boy lies in the 90th percentile, which means that 90 percent of boys with this length (21 inches) weigh less than 10 pounds, and 10 percent weigh more than 10 pounds.
Length-for-age chart
The X-axis has the age of the child and the Y-axis has the length of the child. You need to locate your child’s age and length on the horizontal and vertical lines up to the point where they will intersect. The intersection occurs on a growth curve, which you should follow to the end.
Check out this example of a girl’s length-for-age chart:
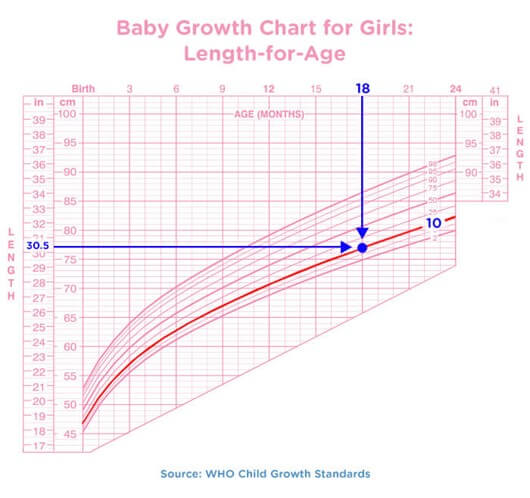
In this example, the child is 18 months old and is 30.5 inches long. She falls in the 10th percentile, which means that 10 percent of girls who are 18 months are shorter and 90 percent of girls of her age are longer.
Weight-for-age chart
The right side of the chart has the baby’s weight (in pounds or kilograms) and the age is on top of the chart (in months). You follow the horizontal lines (Y-axis) and the vertical lines (X-axis) until they intersect. They will intersect in the growth curve, which you should follow to the end to find the baby’s percentile.
Check out the example of a growth chart for a boy’s weight-for-age chart.
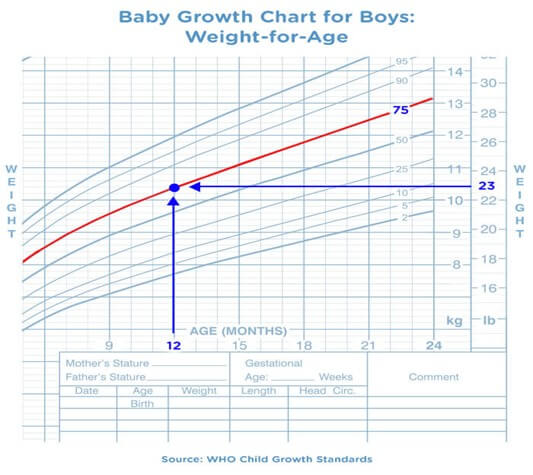
In the example provided, the child is a 12-month-old boy who weighs 23 pounds. The boy falls in the 75th percentile, which means that 75 percent of boys of his age weigh less while 25 percent of boys of his age weigh more.
Instead of busying yourself with the actual measurements provided during clinic visits, you should be more concerned by the patterns and consistencies indicated on the growth charts. If a baby is growing in proportion, there are no red flags; however, you should be concerned if there is a noticeable change in measurement.
For example, you should not be worried if your baby has a lower length and weight as it could mean that the genetic predisposition of the baby is to be skinny and short. However, if the weight percentile of the baby changes from, let’s say, 80th to 25thpercentile, then there could be a problem of eating, which you should be concerned about.
One thing that you need to know when interpreting the results is that babies grow at different paces. Therefore, it is perfectly normal for a baby to be along with the measurements of the 15th or even 99thpercentile. Your only concern should be rapid or extremely noticeable changes.
Percentiles are important in baby growth charts as they show how your child is compared to other children of the same gender and age. Percentiles are represented in the baby growth chart as curved lines.
For example, if your baby lies in the 70th percentile for length-for-age, it means that 70 percent of children of the same gender and age are shorter while 30 percent are longer.
This, in itself, doesn’t provide a complete picture, and your healthcare provider may look into other factors that affect the growth of your child as compared to the average growth curve as indicated in the chart.
While looking at the percentiles, you should not put much focus on the numbers but other factors that influence a baby’s growth such as genetics, nutrition, activity levels, environmental factors, and health problems. The growth spurts of babies are different depending on these factors.
Change in Baby’s Growth Pattern
A change in a baby’s growth pattern does not necessarily show that there is a problem. Sometimes, it could just be that your child is experiencing a growth spurt. However, if you notice a noticeable change in the growth pattern, you should engage your healthcare provider to investigate further. For example, if your child has been heavier than 40% of other children of the same gender and age, and then he/she suddenly becomes heavier than 80% of children of his/her age and gender, then the pediatrician should investigate this.
Another change that you need to be concerned about is if your child is not steadily gaining height and weight.
Below or above average babies
So, you are probably worried if your baby is below or average the growth patterns of other babies of his/her age. A majority of children fall within the 3rd and 97th percentiles. If the child doesn’t fall in this category, there could be a lot of factors that the doctor will be looking into. For example, genetics could be playing a role in the concern for a child being below or above average. This is because some families have inherent genes for fast growth while others have genes for slow growth. As a parent, you should try not to worry a lot but discuss the concerns with your baby’s doctor to determine the right course of action, if there should be any.
The growth chart can be tiresome for most parents. As a parent, avoid direct comparisons between your child and other children and focus on the growth of your child as an individual. If you focus on your child, you will be surprised to see the milestones your child has made that the chart cannot show you because of comparison with other children.
You can download our free templates that will help you read, understand, and interpret the baby growth chart.
WHO growth charts
The World Health Organization Charts are recommended for use for children below two years. Therefore, these are the charts that you should use from birth to 24 months:
CDC Growth Charts
Centers for Disease Control and Prevention (CDC) also has growth charts, which are recommended for use for children above 24 months (2 years). These are the CDC growth charts that you should use for children above 24 months:
With all the information shared here, you do not have to worry about your child anymore. You can now comfortably understand the growth patterns of your child using the baby growth charts provided.
Looking For Document Management System?
Call Pursho @ 0731-6725516
Check PURSHO WRYTES Automatic Content Generator
https://wrytes.purshology.com/home
Telegram Group One Must Follow :
For Startups: https://t.me/daily_business_reads

