
Let’s play a quick game of “would you rather.” Would you rather manually sift through 6,000 rows of data in a spreadsheet to guide your next business strategy or have software do it for you?

If you prefer the former, you may be a data scientist (or a masochist). If you’re anything like me, you cringe at the sight of uncategorized data and would much rather see an organized report or a series of data visualizations. Either way—we both need business intelligence.
So what is business intelligence, and how can you use it to make business decisions easier? In this guide, I unpack why you should implement a business intelligence strategy and what that may look like.
Table of contents:
Quick overview: What is business intelligence?
Business intelligence (BI) refers to all of the tools that collect, organize, and analyze data to determine how a business is doing and how it can improve from there.
Don’t panic—BI doesn’t mean your job as a business executive or data analyst is being taken over by robots. Organizing data into reports is only half the battle. Your job is to pull insights from that data and to make sound, human decisions. BI just automates the otherwise tedious process of data extraction and analysis, making your job a whole lot easier—and more effective.
Business intelligence vs. data analytics
Data analytics and business intelligence are used together to develop strategic insights for businesses.
Typically, data science professionals will interpret the results of business data analytics before BI makes the language less technical. Essentially, BI simplifies insights from data analytics to easier-to-parse business terms.
Think of it like the difference between a study conducted about a technical health topic and an article published about the study. The study’s results may feel like a foreign language, but the article explains its implications and provides recommendations for readers to take home.
Here’s another example:
-
As a digital marketer at an agency, I generate reports for my clients that summarize their performance using clear and actionable language. This part of my job parallels business intelligence.
-
To generate those reports, I first need to pull and analyze raw performance data. For example, I’ll look at metrics like pageviews, bounce rates, CTR, and keyword movements as well as external factors that may play a role in their performance. This is where data analytics comes into play.
Benefits of business intelligence
Let’s assume you aren’t thrilled about the prospect of manual data analysis and interpreting results. Here are some reasons BI can make your systems work better.
-
Improved efficiency: It takes a lot longer to know what’s going on in a spreadsheet than in a report filled with charts and graphs. BI converts the results of data analysis into data visualizations and other digestible formats that make it easier to make business strategy decisions. Plus, automating this step can save endless hours of sifting through data and minimize the chances of human error.
-
Improved decision-making: BI is data-driven, which helps to ensure you’re making sound decisions. For example, business intelligence tools can generate dashboards and reports based on sales data that communicate what products are selling poorly and should either be discontinued or modified.
-
Improved employee impact: BI makes data analysis more accessible, freeing up time that IT teams and data analysts would have spent responding to user requests. With BI, employees are empowered to conduct their own analyses and pull insights from them.
-
Improved customer satisfaction: The last group to feel the effects of BI is arguably the most important: your customers and clients. Data-driven decisions make it far easier to meet your customers’ needs.
Business intelligence strategy: Using the right data for the right reasons
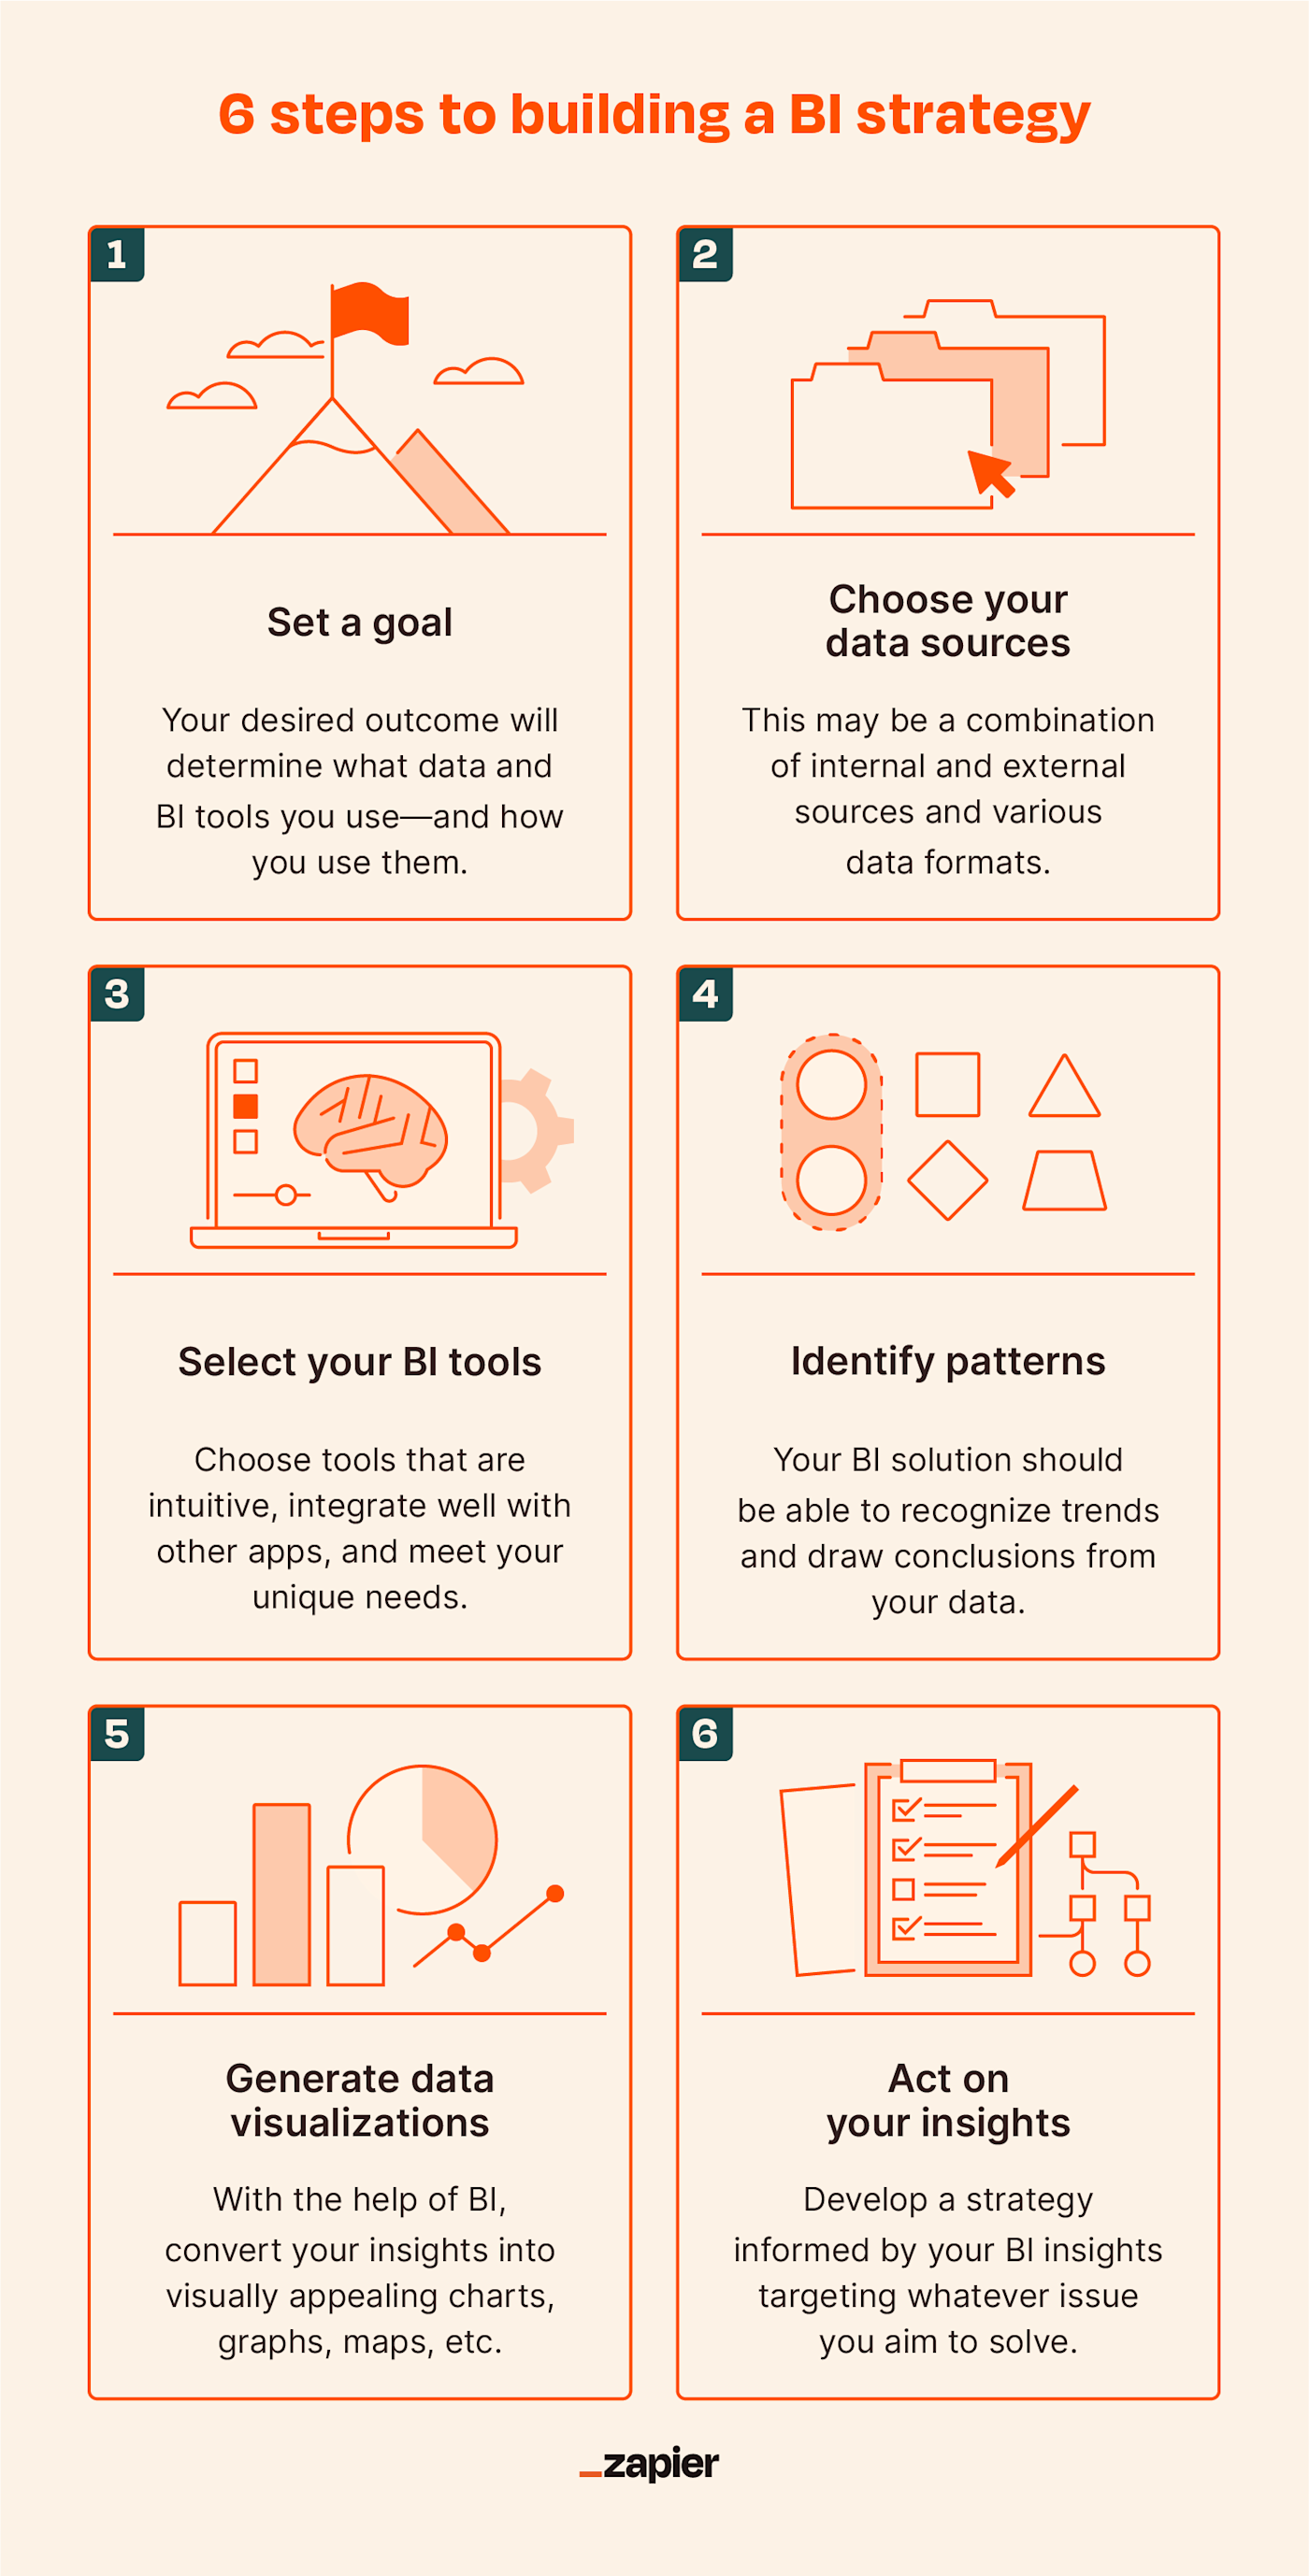
1. Know your goals for business intelligence
BI’s uses are virtually unlimited. The first step to implementing it is deciding what business objective you want to accomplish. Do you want to compare the performance of your sales channels, use data from past marketing campaigns to inform your next one, or create a new HR dashboard with employee utilization data?
Example: A clothing company’s goal may be to reduce the quantity of returns customers make.
2. Identify the datasets you’ll need to solve your problem
For many uses of BI, you can rely entirely on trusted internal data, but some issues require external data. For example, you may want to take data published in a trade journal into consideration when implementing BI.
Example: That same clothing company may collect additional data from customers based on their buying patterns to identify what styles they like best and better market those styles to them.
3. Use the right tools to gather and organize it
Once you have all of your data sources collected, you’re ready to choose the tools to transform, analyze, and learn from the data. The platform(s) you use will depend on your goals for BI, which is why determining those in Step 1 is vital.
Look for tools with the following functionalities to best accomplish your goals:
-
Automated data modeling and analytics
-
Ability to manipulate data to draw additional insights
-
Interactivity with data visualizations
-
Cross-team collaboration
Example: The clothing company may use a BI solution with powerful analytics capabilities to break down what customer data means about their interests and buying habits.
4. Uncover trends in your data
Leave it to the robots to identify patterns and create predictions from data. Most BI tools are built to execute descriptive and predictive analysis, which can shed light on where your business stands. For example, your BI platform might look at employee turnover history and make predictions about which departments need the most aggressive recruiting efforts and when.
Example: The clothing company’s BI software may identify that customers are consistently returning a certain type of romper due to issues with fit, suggesting the company should reassess the item’s design.
5. Present your findings using data visualizations
We’ve established that (almost) everyone prefers a colorful chart, graph, or map to a data-heavy spreadsheet. Data visualizations are especially useful when sharing findings with an entire team—they’re easier to digest and are therefore better for motivating action toward a goal.
Example: The clothing company may use BI-generated charts to uncover how much profitability could increase by better targeting customers with personalized marketing efforts.
6. Apply your learnings
BI tools help show you where action can be taken, but they can’t take action for you. Develop short- and long-term strategies based on your findings to tackle your problem areas, whether those be internal inefficiencies, supply/demand problems, or customer service shortcomings.
Example: The clothing company may initially phase out generally unpopular styles while collecting more customer data, then proceed to adjust its marketing strategy a few months down the line.
Business intelligence methods and examples
Consider using BI to help with the following:
-
Data mining: Data mining takes data from existing refined datasets and turns it into actionable information. For example, a company may use data mining to pull historical data on customer bounce rate. This could help the company identify which pages it should modify to better lead customers down the buyer funnel.
-
Visualizations: Maybe all of your data is organized and consolidated, but you have to present your findings to a large audience. Use BI to generate clear and aesthetically pleasing data visualizations. For example, a company executive might use BI to generate a series of charts illustrating their company’s new strategy and present them at a conference.
-
Reporting: Another practical way to present data findings is through report generation. An agency may, for example, use BI to turn data from several successful case studies into a presentation for a prospective client who’s skeptical about the agency’s services.
-
Benchmarking: BI can pull and analyze data from competitors to help a business set benchmarks for its metrics. For example, if BI identifies that equally-sized competitors are averaging 15% more units sold per month, company leadership may tweak its benchmark to approach this number.
How to choose a business intelligence solution
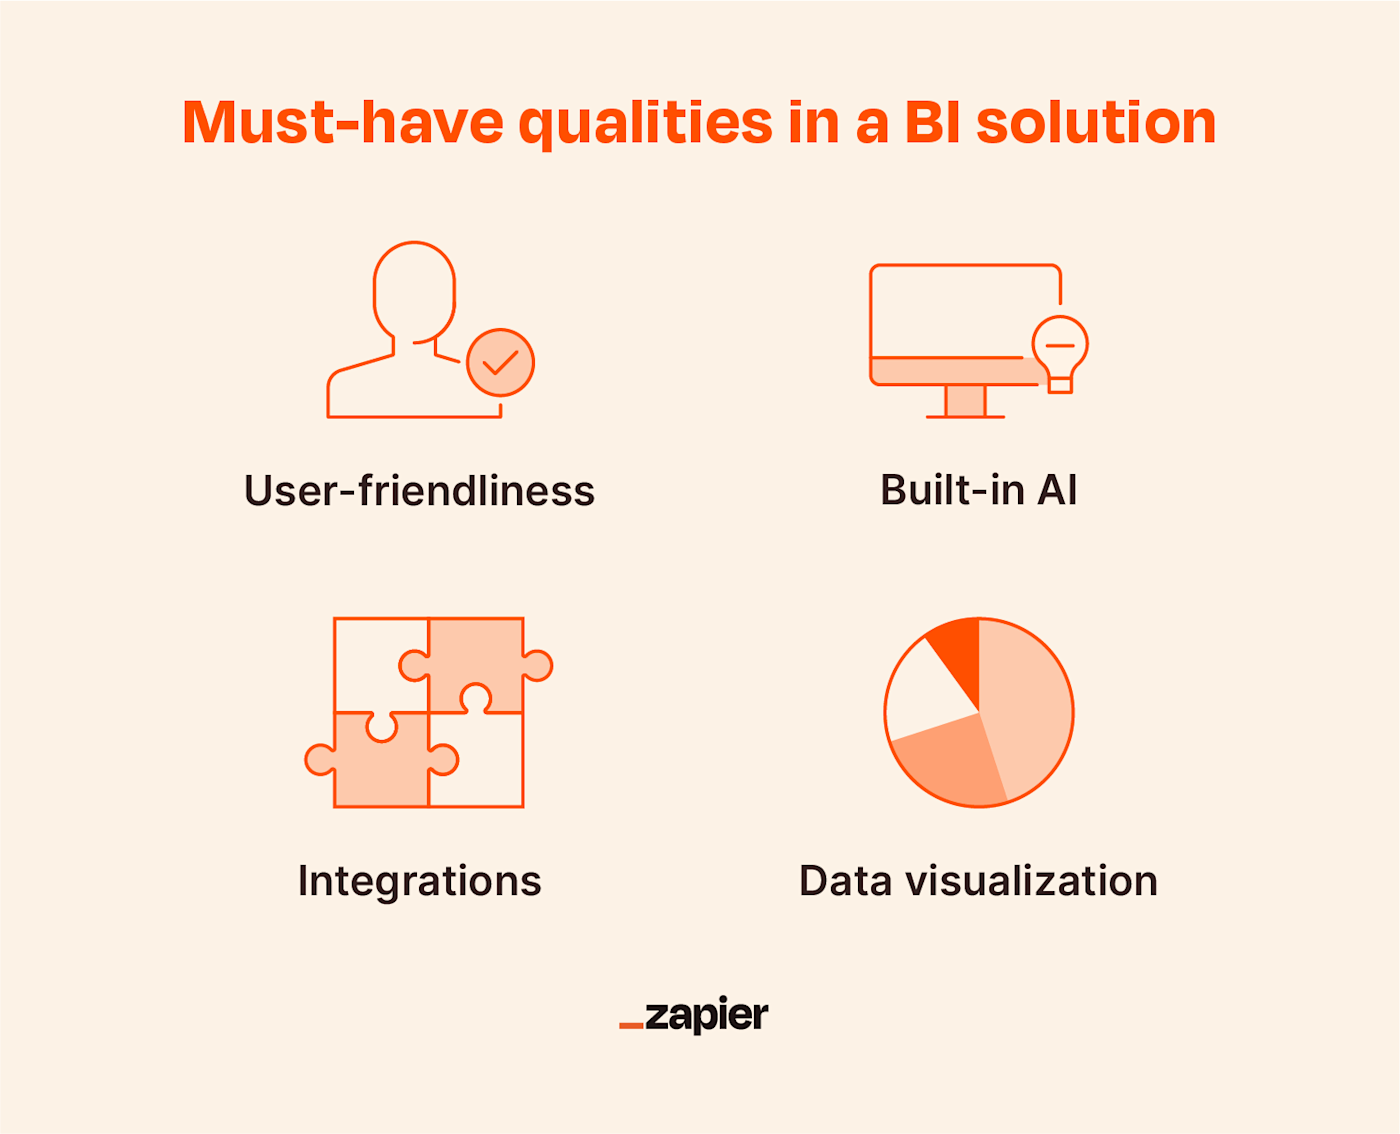
Apart from choosing a BI tool that meets your unique needs, be sure that whatever solution you choose includes the following qualities:
-
Ease of use: Minimize frustration by choosing a tool with a clear, easily navigable interface. Google Data Studio, for example, keeps reports clean and organized and makes it easy to modify their look and feel.
-
Built-in AI: AI allows the robots to sound more like humans, delivering clear and concrete business recommendations. For example, Salesforce’s Einstein Analytics uses AI to enhance its BI capabilities.
-
Integration capabilities: Enhance your BI process with the help of integrations. With the help of Zapier, you can connect BI tools like Zoho Analytics with thousands of popular apps to make BI seamless.
-
Extensive data visualization options: Most BI solutions have data visualization capabilities, but not all are equal in this area. Qlik specializes in visualization, turning your data into captivating visual dashboards.
Once you’ve implemented business intelligence software, automate it with Zapier so you can spend time making your customers happy instead of frying your brain staring at spreadsheets.
Here are some more helpful guides to check out as you get started:
Need Any Technology Assistance? Call Pursho @ 0731-6725516


