As you research Instagram management tips, you’ll find tons of marketers hyping up analytics and explaining how to check them. That’s important, but they don’t tell you what you should do with those analytics. You know your post has 100 likes, but what does that mean in the grand scheme of your social media strategy?

I’m going to show you how to check your Instagram analytics and figure out what they can tell you about the big picture.
How to check analytics on Instagram
Instagram has a robust analytics platform in its own app. The catch is that you can only access them on the mobile version. Here’s how to check Instagram analytics straight from the source.
The main Insights page
Before you can check your account’s analytics, Instagram requires you to switch to a business or creator account.
-
Go to your profile, and click on the triple lines in the upper-right corner of the screen.
-
Click Settings > Account > Switch to Professional Account.
-
Choose whether you want to be a business or an individual creator, then follow the prompts to get set up.
-
Once you have a professional account, you can go back to the triple-line menu and click on Insights to see Instagram analytics.
-
Menu still stuck on Get Insights (like mine was)? Go to your profile, and click the Professional dashboard option above your grid, then See all next to Account insights.
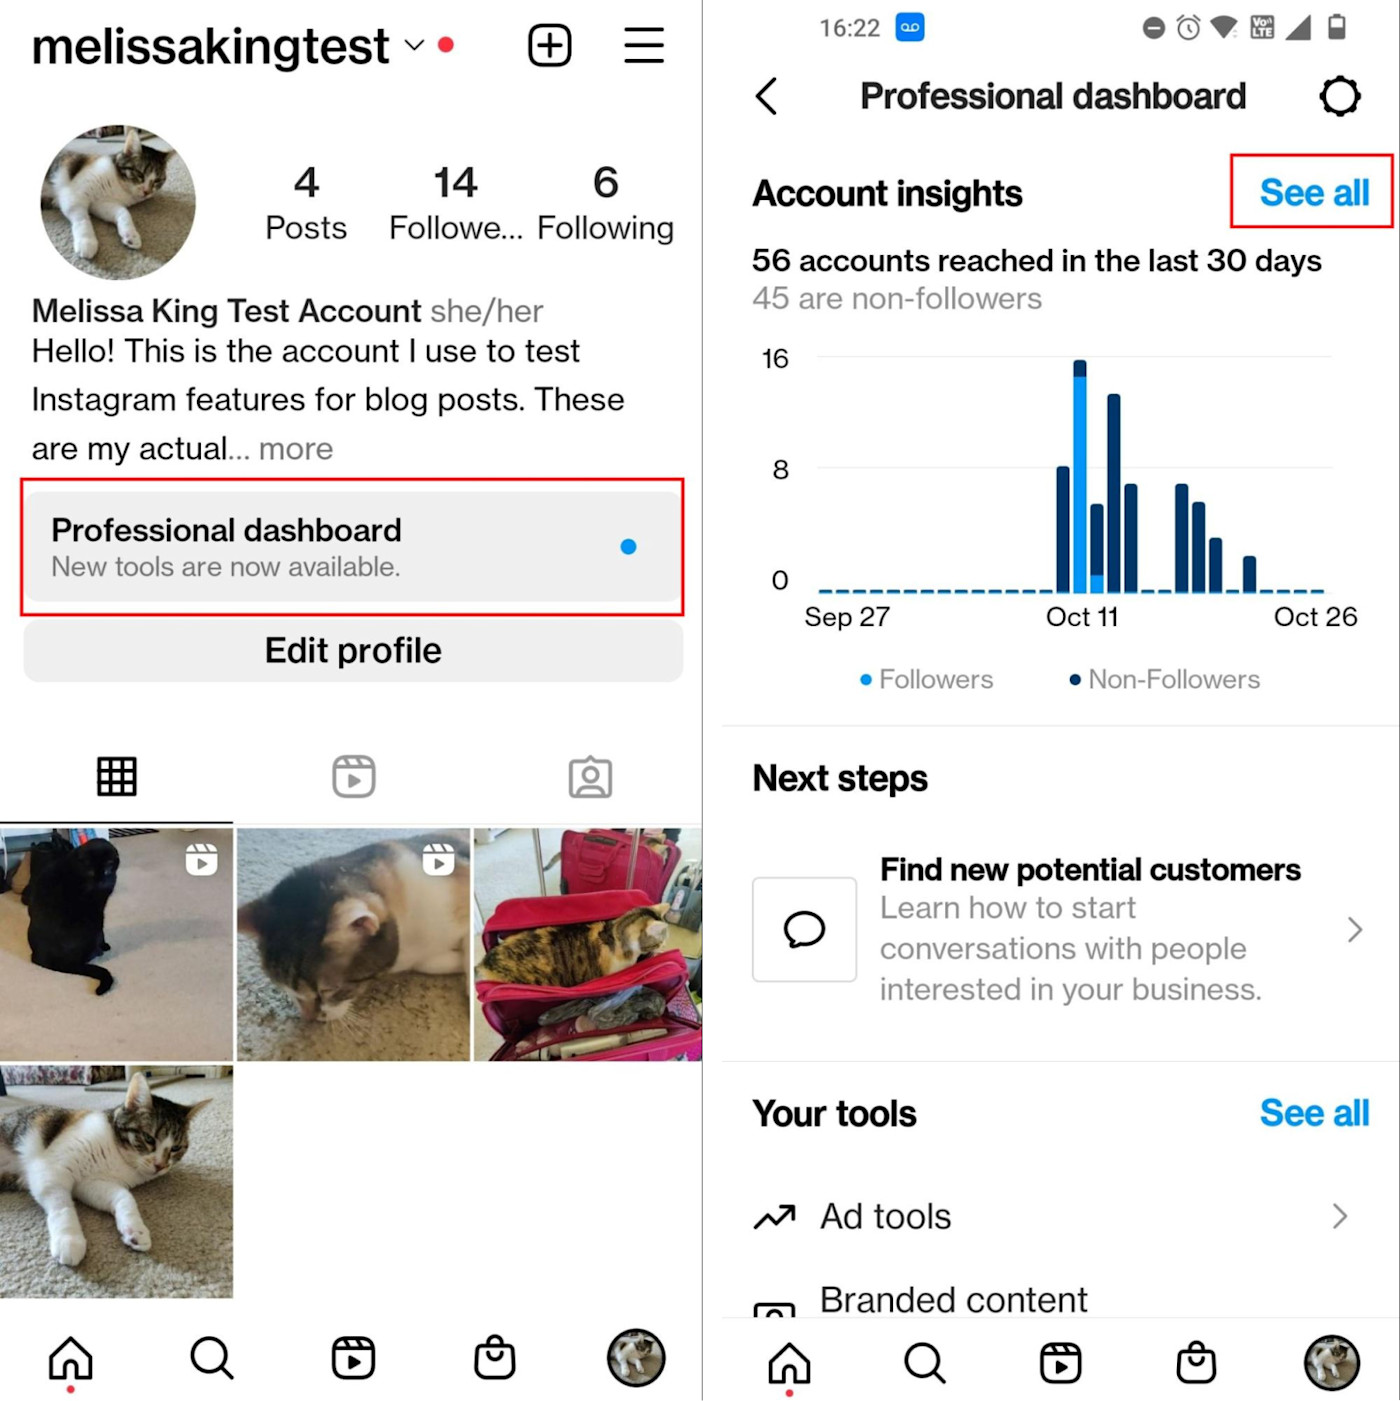
The main Insights page provides an overview of your account activity for the time period you specify in the dropdown menu at the top of the screen.
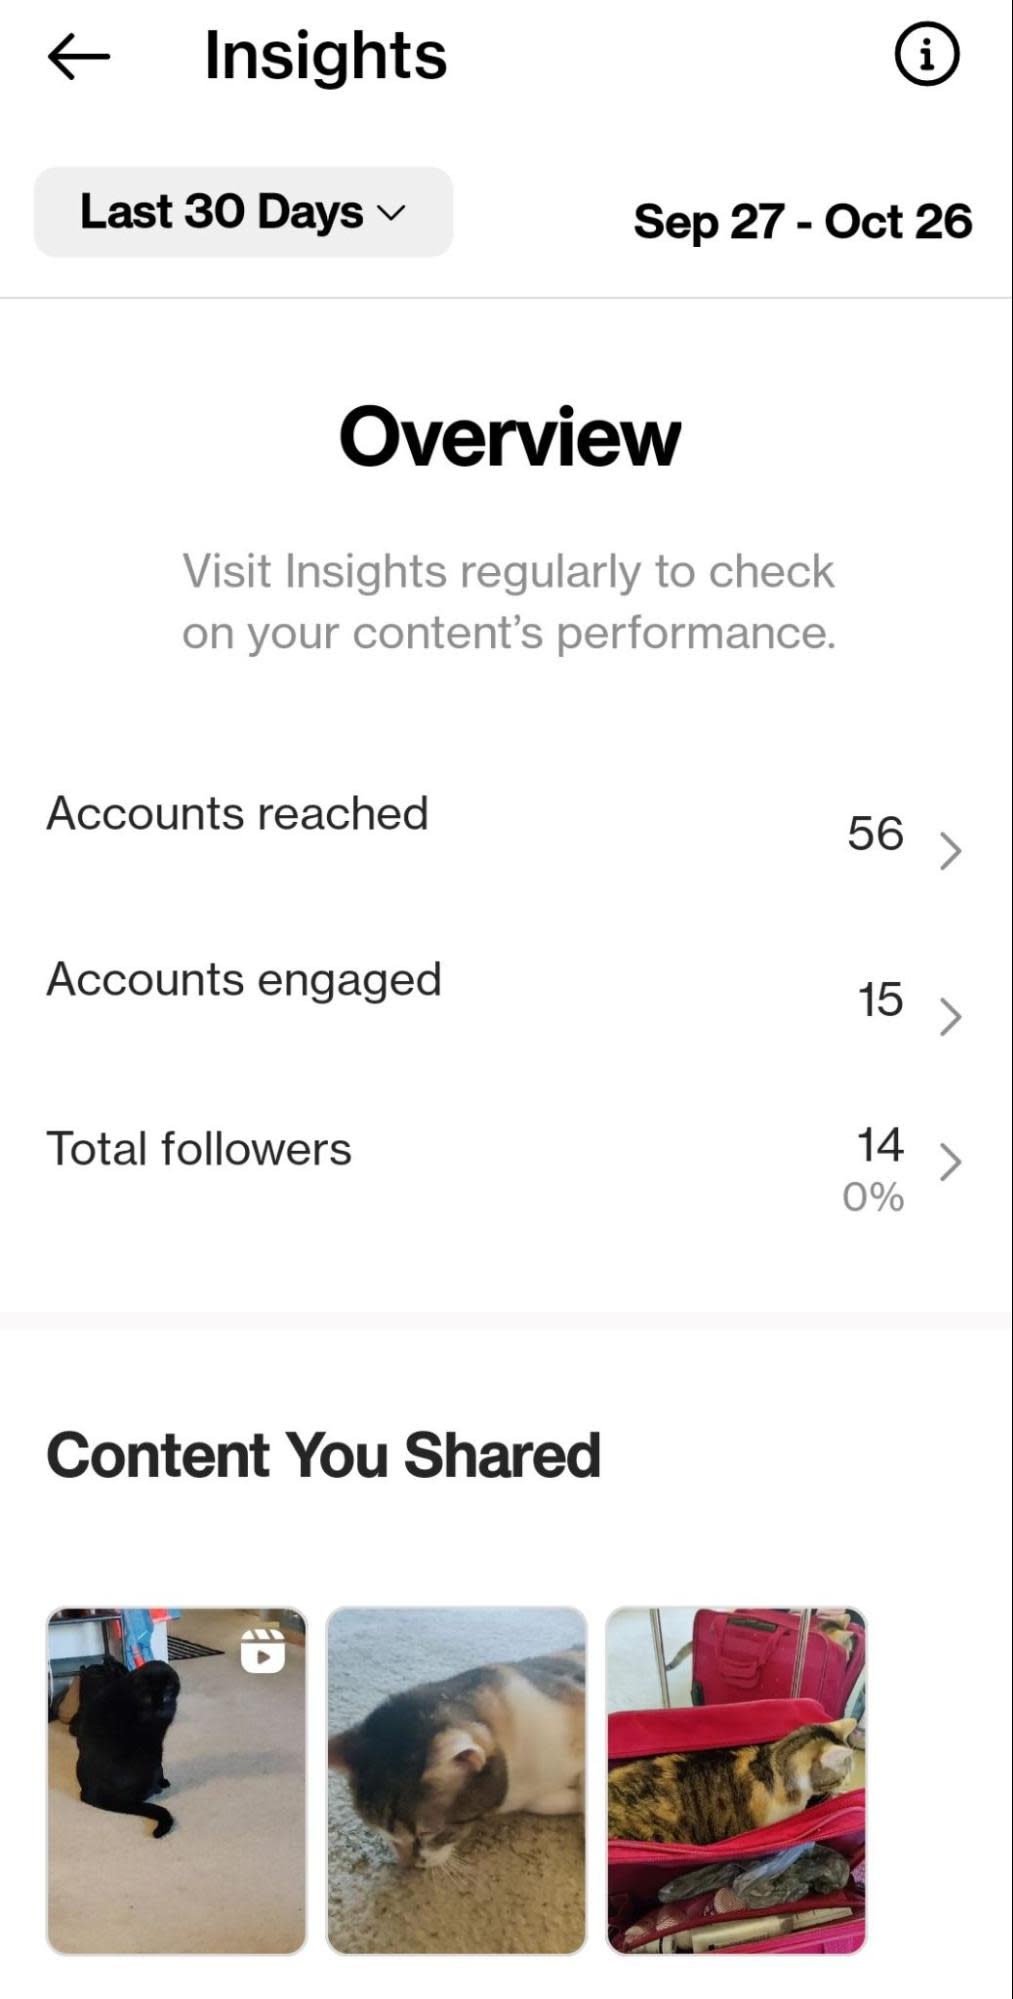
This page has two sections:
-
Overview: Here you’ll see the number of accounts your content reached, the number of accounts that engaged with your content, and your total followers for the time period. Click on each stat to go into a dedicated analytics page.
-
Content You Shared: This section shows the content you shared during the time period, with clickable sections for different content types. It directs you to individual posts for analysis.
Now, let’s dig into each of the sections you can visit in Instagram Insights.
Accounts reached
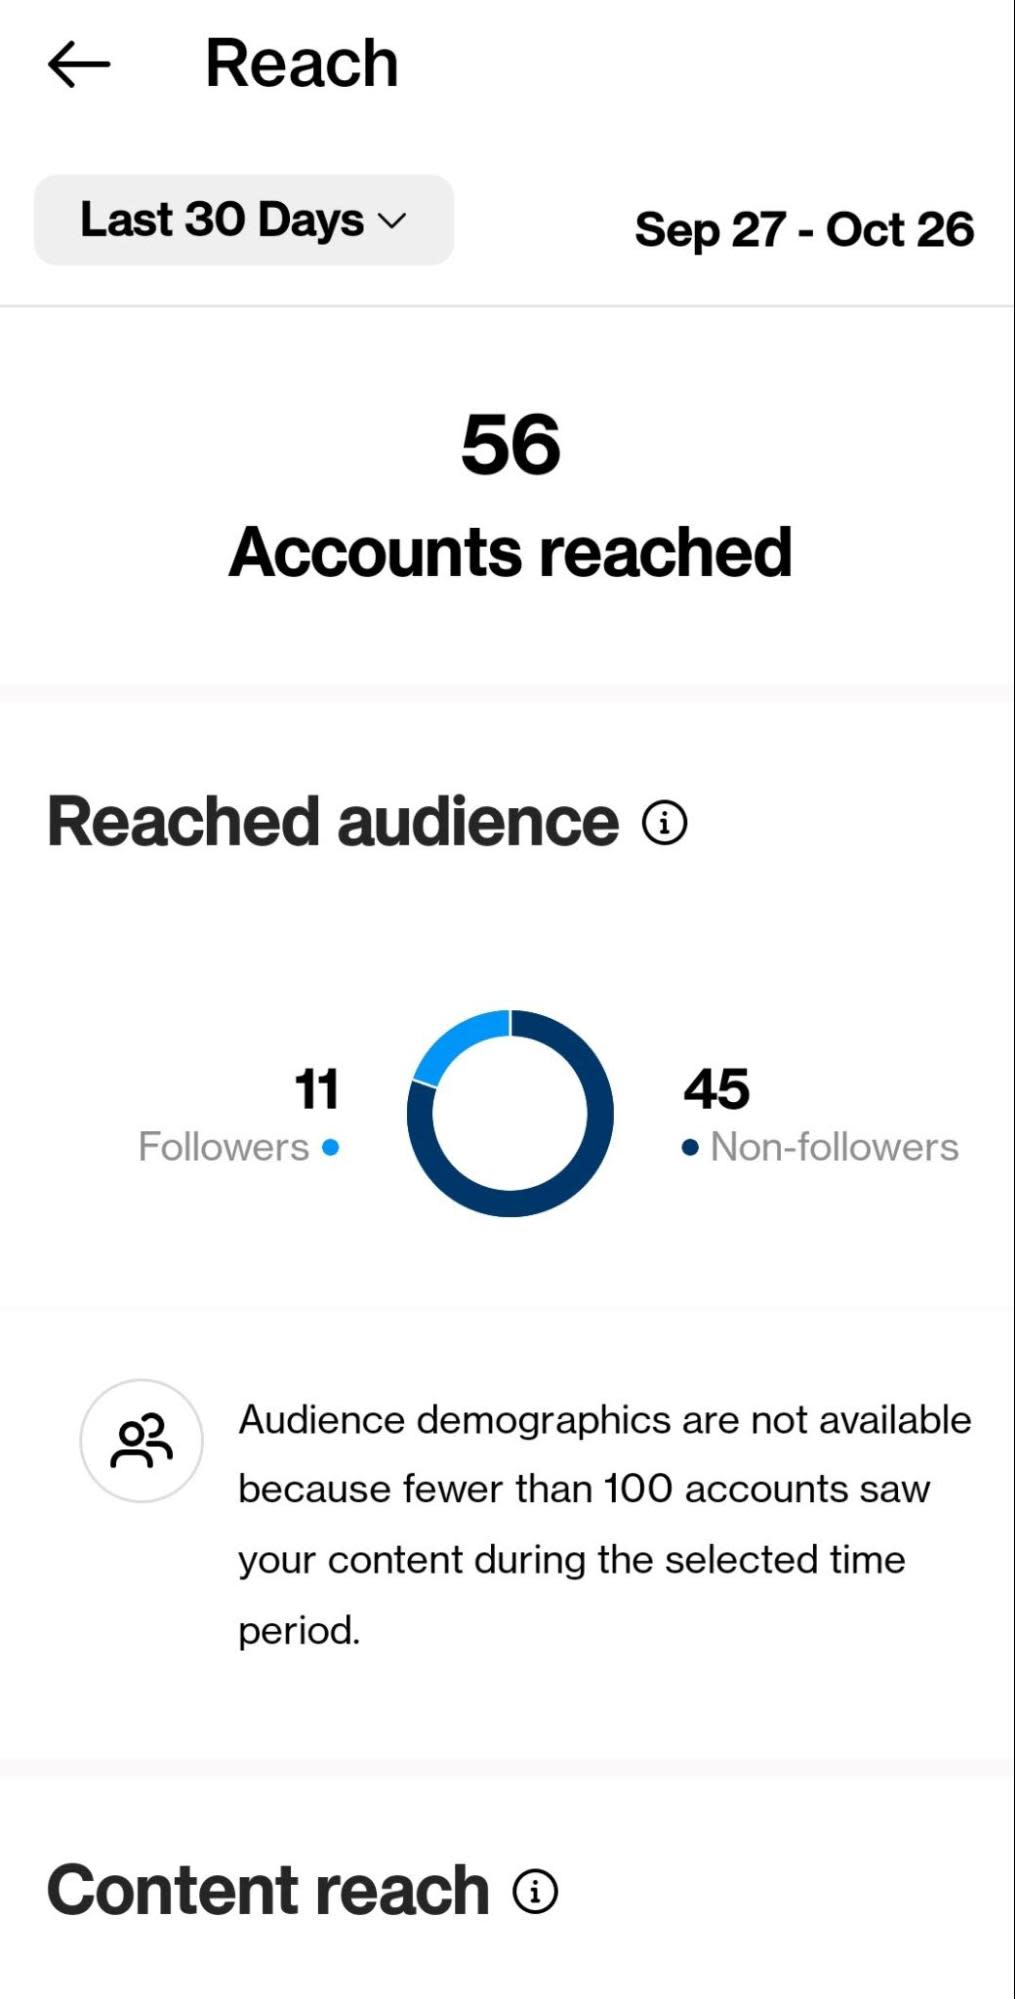
The Accounts reached section explores your reach—the number of people who saw your posts. It covers the following metrics:
-
Accounts reached: Number of accounts that came across any of your posts
-
Reached audience: Demographics and ratio of followers to non-followers among the users you reached
-
Content reach: Your reach organized by type of content
-
Top content: Posts, Stories, Reels, videos, and Live videos that received the most reach in the time period
-
Impressions: Number of times someone came across your posts, including repeat visits from the same user
-
Profile activity: Actions taken on your profile, such as profile visits and website taps
Accounts engaged
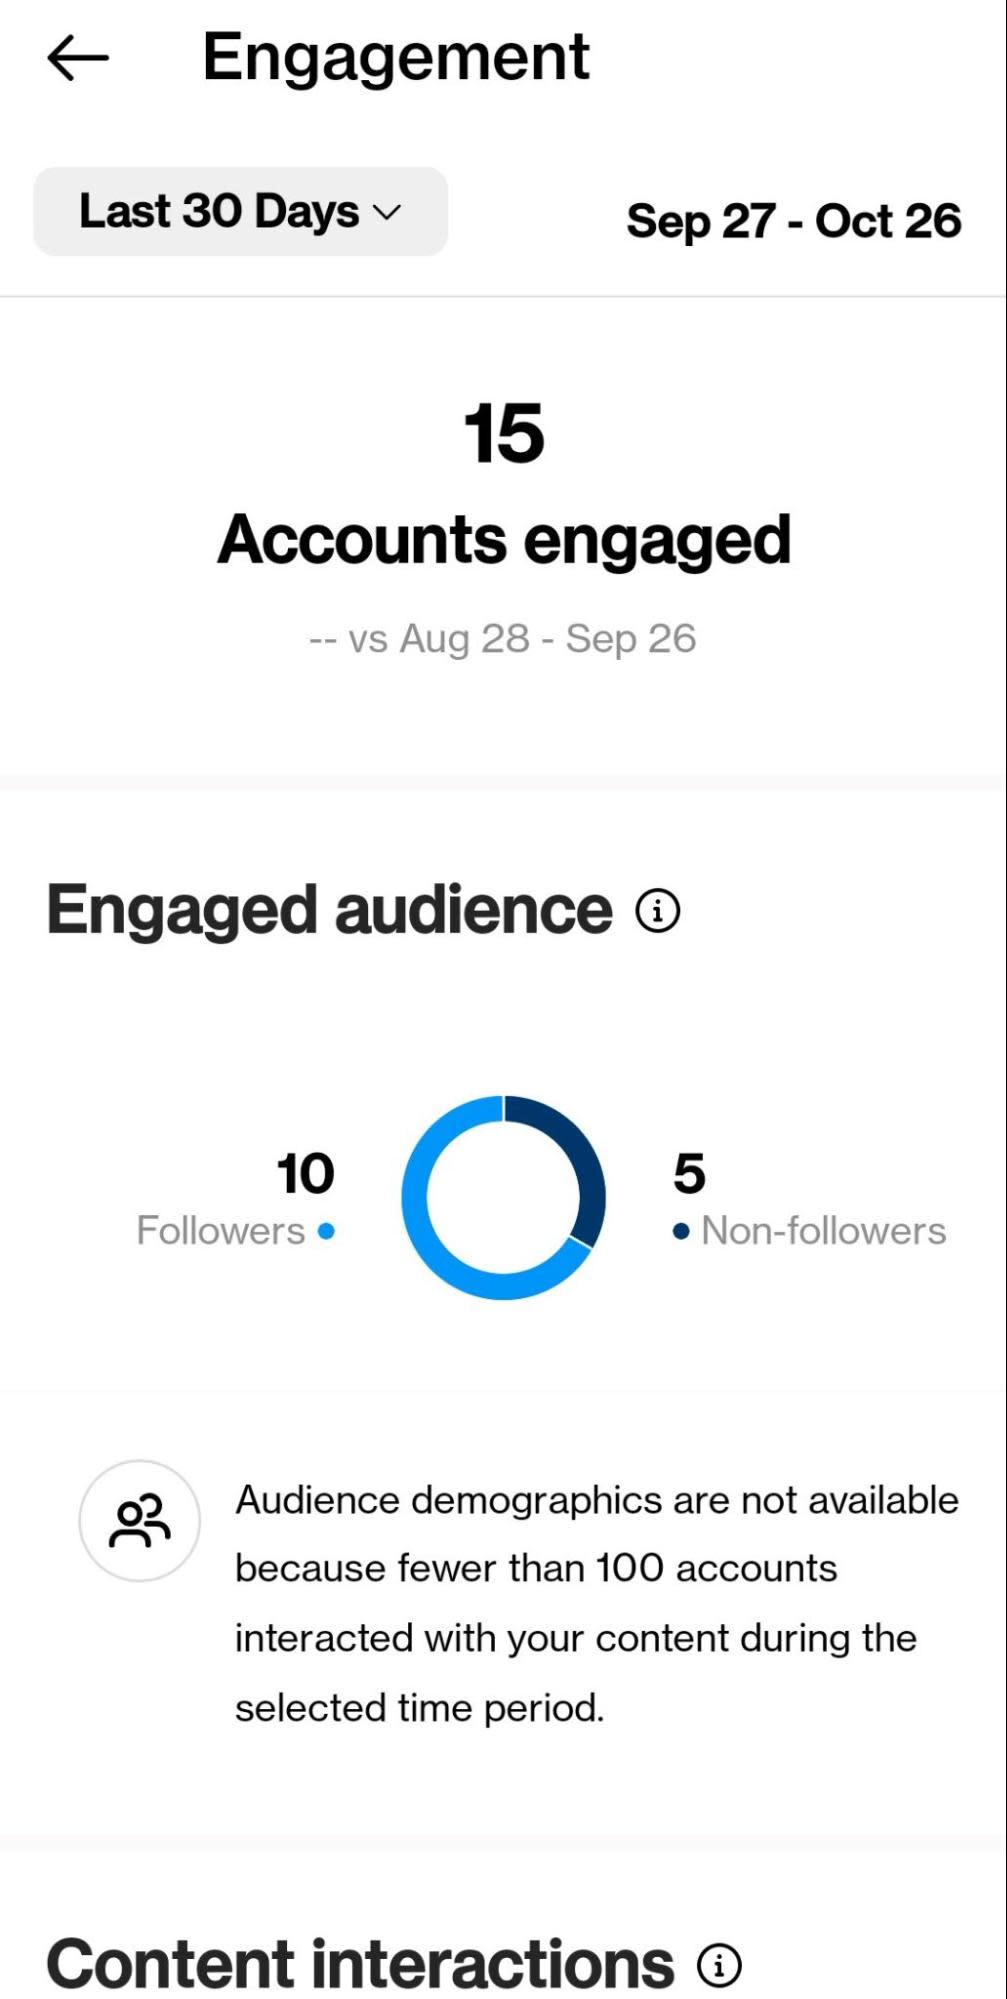
In the Accounts engaged section, you’ll find stats related to the times people engaged with your posts, such as:
-
Accounts engaged: Number of accounts that engaged with your content
-
Engaged audience: Demographics and follower to non-follower ratio of accounts that engaged with your content
-
Content interactions: Number of interactions your content received, displayed as a whole and broken down by content type
-
Top content: Top Stories, posts, Reels, videos, and Live videos by engagement
Followers
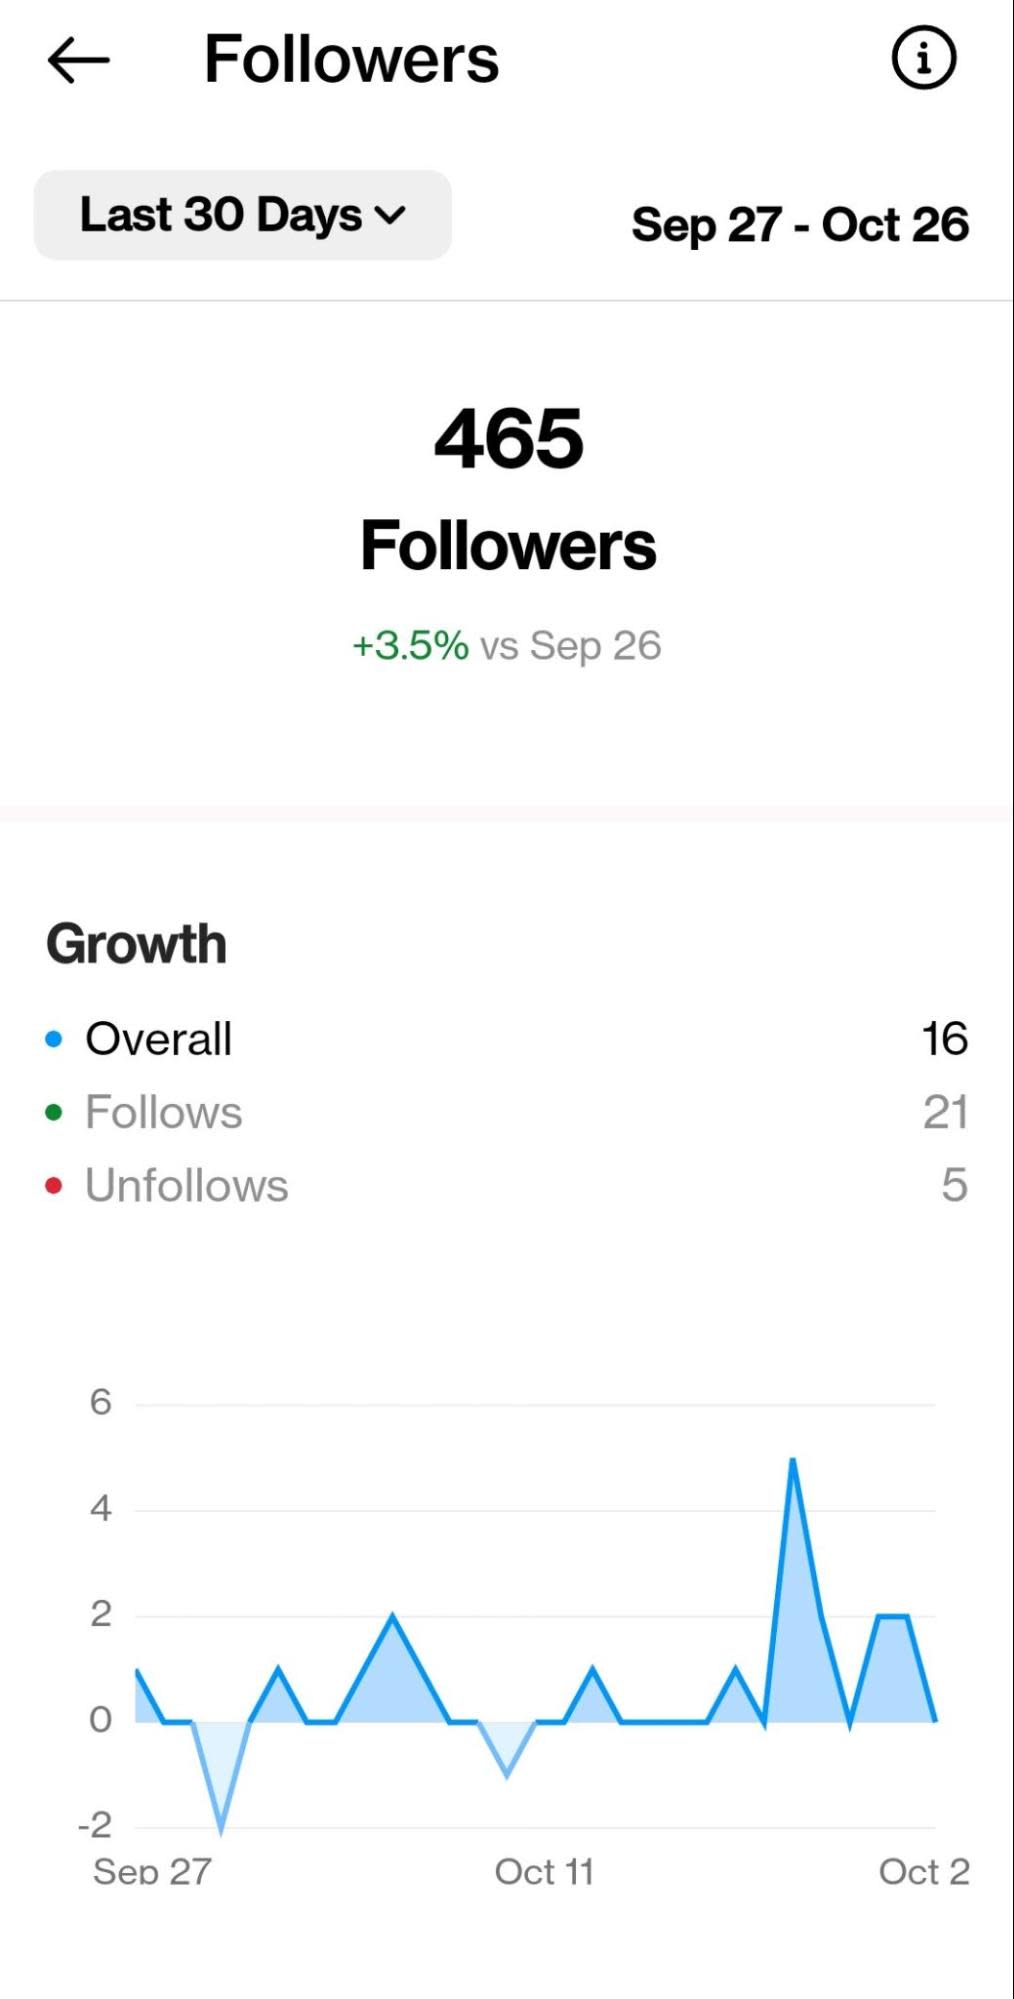
Your Instagram Followers analytics include numbers on follower traits and behavior like:
-
Followers: Total number of followers, plus the percentage growth of followers you received in the specified time period
-
Growth: Overall follower trends, covering follows and unfollows
-
Top locations: Most frequent locations for your followers
-
Age range: Most common ages for your followers, organizable by all genders, men, and women
-
Gender: Percentage of followers who are men and women
-
Most active times: Your followers’ most popular times to use Instagram, organizable by hour or day
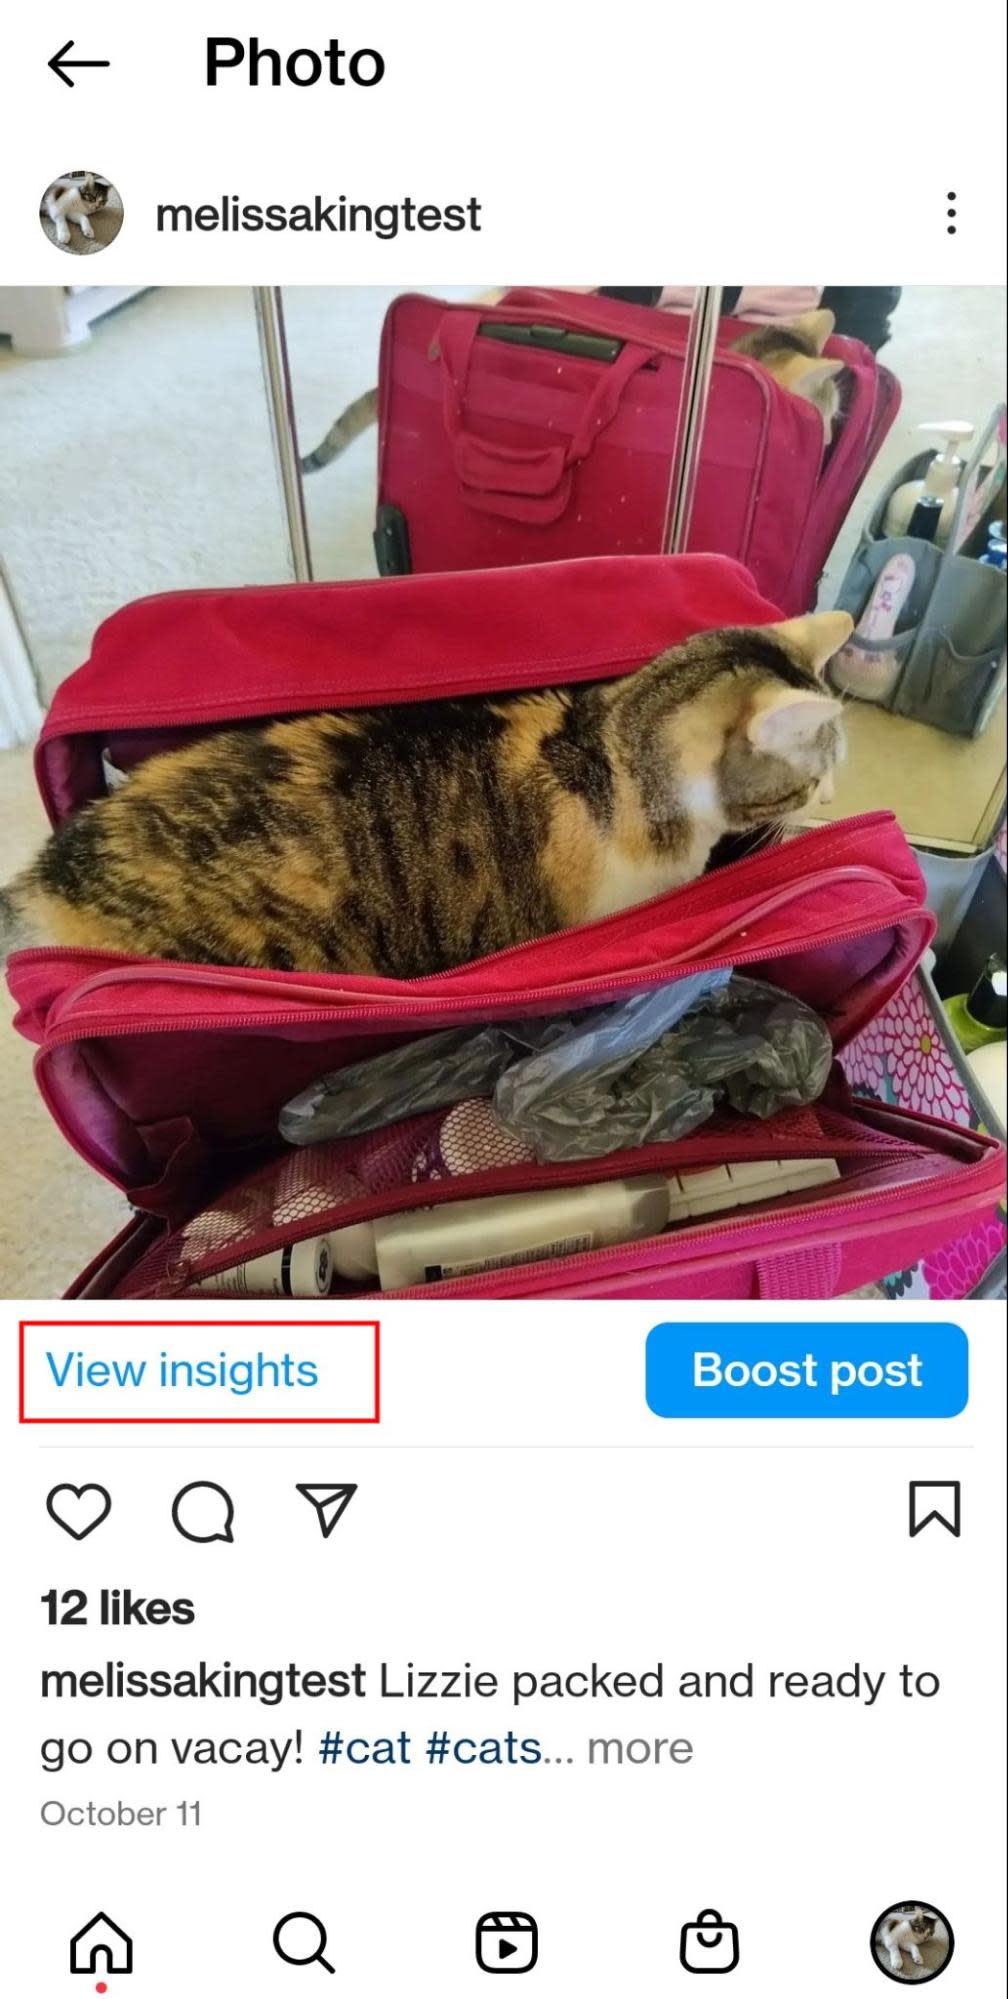
Checking Insights for specific posts, Stories, Live Videos, and Reels
You can see analytics for a specific piece of content by visiting it from Insights’ Content You Shared section or your profile. For a post or Reel, you’ll see a View insights link right below it:
For other content:
That link will give you a detailed look into your content’s stats, including:
-
Plays, likes, comments, shares, and saves
-
Accounts reached
-
Impressions
-
Engagement from followers vs. non-followers
-
Profile activity resulting from this content
Each type of content has unique analytics pages and metrics. For example, Stories have metrics about swiping behavior, while videos include info on watching patterns.
How to check Instagram analytics on Meta Business Suite
Meta Business Suite lets you look at your Instagram and Facebook metrics side-by-side on desktop or mobile. It offers a different set of analytics from Instagram Insights that offers new perspectives on your performance. Go to Meta Business Suite by visiting https://business.facebook.com/.
If you haven’t already, create a Meta Business Account and connect it to your Instagram following the Meta help center’s instructions. You might already have your Facebook and Instagram pages in the Business Suite if they were pulled in from previous versions of Facebook’s backend.
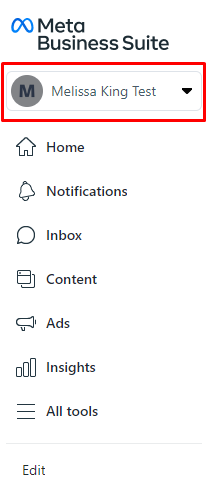
Manage multiple pages? Find your Instagram page by going to the top of the left-hand menu and clicking the dropdown menu with your page’s name.
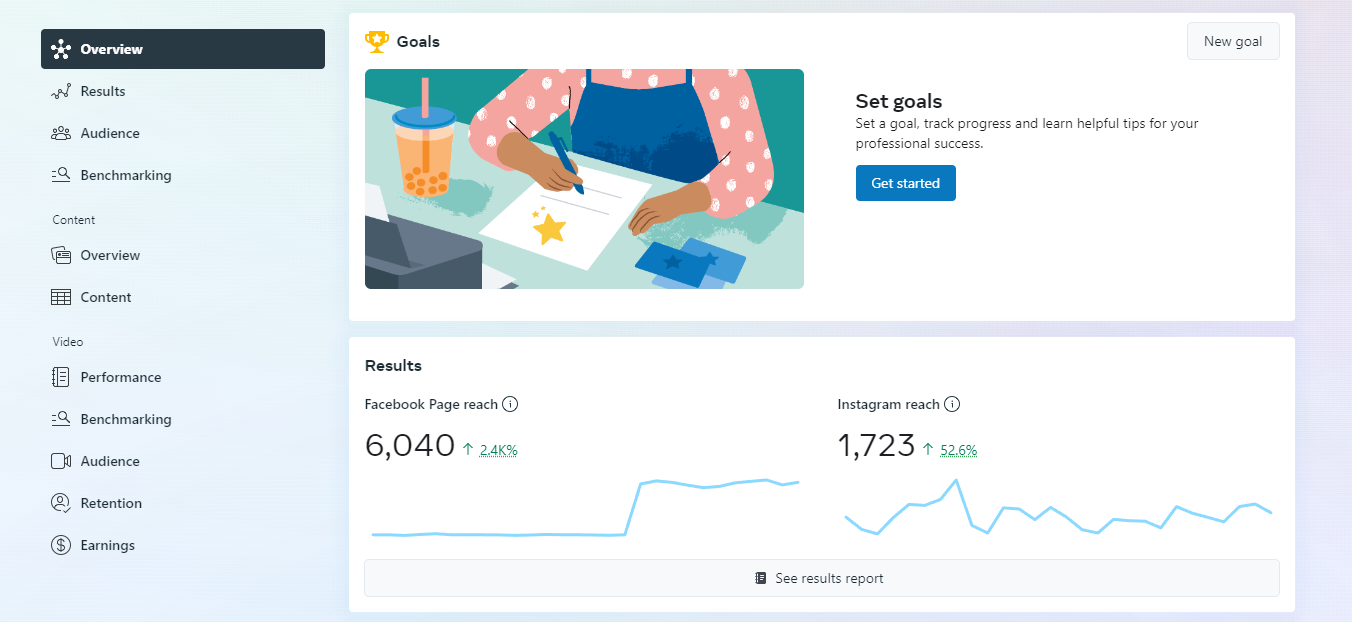
See Instagram analytics in Meta Business Suite by clicking the Insights option in the left-hand menu. There, you’ll have access to the following tabs:
-
Overview: Custom analytics goals plus quick overviews of your reach, content, and audience
-
Results: Page reach, visits, and followers
-
Audience: Current audience’s ages, location, and gender compared to the full Meta audience
-
Benchmarking: Your profile’s performance compared to profiles for similar businesses
-
Content Overview: Reach, engagement, and performance ranking for posts and Stories
-
Content: A list of all your ads, posts, and Stories with detailed engagement metrics
-
Video Performance: Video view time and top-performing videos
-
Video Benchmarking: Your videos’ performance compared to others in your industry
-
Video Audience: Existing, new, and reactivated followers who watched your videos
-
Video Retention: Audience sources for your videos and how long people watch them
-
Video Earnings: Earnings from video ads on Meta platforms
How to get Instagram analytics using a third-party social media tool
You can also get Instagram analytics through a social media management tool. These apps let you schedule posts and look at analytics for multiple platforms in one app, but you’ll usually need a paid plan for more than surface-level analytics.
The level of depth you’ll get for a third-party analytics tool depends on the app you choose. But they tend to pull many of the same analytics you’ll find in Instagram Insights or Meta Business Suite. Smaller-scale businesses and creators can get away with sticking to native tools, as long as they don’t mind clicking through multiple interfaces. That approach can get harder as you scale your business and accounts, though.
Take a look at Zapier’s list of the best social media management tools to start your search. The options on that list are all cross-platform, but you have a few options if you want an Instagram analytics tool specifically. Later is now a multi-platform tool, but it started Instagram-specific, so it has solid features. Analisa.io offers free and paid analytics for Instagram and TikTok, the two most popular platforms for influencers.
Which Instagram metrics to pay attention to (and how to optimize them)
Here’s how to understand some common Instagram analytics metrics categories and what to do to optimize them. Look how these groups directly correspond to the sections in Instagram’s Insights—they’re each an important touchpoint in understanding your social media’s results.
Reach
Metrics such as accounts reached and reached audience relate to reach: the number of accounts that see your content.
Check the balance of followers versus non-followers in Instagram Insights to better understand who comes across your posts. If you don’t see many non-followers seeing your content, you might benefit from strategies to increase your reach.
-
Use relevant hashtags in your posts. People on Instagram often follow or search for hashtags to find new content. Zapier’s guide to Instagram strategies for businesses offers tips for using hashtags properly.
-
Mix up your content formats. Buffer recommends going beyond the typical photo post by experimenting with ads, Stories, Live videos, and regular videos. Instagram’s newer Reels format has its own algorithm, so consider them as a new avenue for reach as well.
-
Go through your Instagram settings to make your content as shareable as possible. Social Media Examiner explains how to turn on Story sharing, Reel remixing, and branded content tags to increase your audience’s options for sharing your content. When your audience shares content from your account, they’re getting a new set of eyes on it.
Engagement
Engagement metrics involve your audience’s interactions with your posts, such as likes and comments. They signify your content’s relevance to your audience. Instagram also has unique engagement metrics, such as swipes on Stories and taps on website links.
Check your engagement rate by dividing your total engagements by your followers, then by people reached. This ratio shows how many of the people seeing your content actually engage with it. For your reference, the RivalIQ benchmark report discovered a median engagement rate of 0.064% using the follower calculation.
If you’re happy with that rate but want to increase your overall numbers, go back to your reach and work on strategies there. Meanwhile, if you want to increase your engagement rate, add these tactics to your strategy:
-
Make your content more personal and relevant to your audience. As Zapier’s guide to creating content that sells shows, engaging content puts people first and your brand second. Think about your audience and what they want to see on their feed.
-
Add calls to action to your content. Later advises asking your audience questions to start a conversation in your comments. You can also include a more traditional call to action that encourages people to click your link in bio.
-
Engage with your audience. Some of Hootsuite’s suggestions for improving engagement urge you to promote engagement through reward. Share user-generated content and reply to comments to show you’re worth engaging with.
Audience behavior
Instagram also has metrics related to audience behavior that don’t have “bad” results, but they can influence how you share content with your audience. The demographics and most popular times in Instagram Insights help you match your content to your intended audience and develop an ideal posting schedule.
For example, if your demographics skew older and you don’t see your meme posts performing, you could try more informative posts. Or, you notice your audience using Instagram at 2 p.m., but you post at 8 a.m. Changing one of your posting times to 2 p.m. will put your content at the top of their chronological feeds.
If your demographics data doesn’t quite match the audience you had in mind, you might need to research your target audience. You could also use that new data as evidence for a new target audience.
Design a social media strategy for success
Now that you know how your Instagram performance plays into your social media strategy, look at your cross-platform strategy as a whole. Use Zapier’s template to create an in-depth strategy for your entire social presence.
Related reading:
Need Any Technology Assistance? Call Pursho @ 0731-6725516

")
