Digital transformation consultant and experienced marketing director Pascal Moyon shares his approach to search analysis and strategy for digital businesses.
The CMO is said to be the most exposed job in a company: study after study there has been a consistent story for at least ten years that CEOs don’t trust their CMO and marketing teams. The changing face of marketing means that your traditional CMO needs to evolve their tool kit to be still seen as relevant in todays landscape.
My story is how I addressed this challenge over the last 10 years, using a data source that you are very familiar with, to build a strategic case for search projects with the C-suite. I have been Marketing Director, CDO, VP of Marketing and have had to manage large budgets and teams for Hertz, lastminute.com, GoCompare, as well as helped companies like HSBC and Canon to design their digital roadmap.
Whilst I describe the evolution of the thought process over the years and companies, the main take-away is that success starts with choosing the appropriate marketing mix based on the nature of the market.
The second learning is that powerful stories are critical to set organisations in motion: it took me some time to build the right visualisations which enable the marketing team to engage effectively with the entire company by making the strategy easy to understand in just a couple of slides.
Framing the marketing problem: identify what is your market channel footprint
My background is not marketing, but engineering and mathematics. As a result, I tend to approach any new job or assignment as a problem to solve, and to solve a problem, half of the work is about framing correctly.
Imagine the situation: you have just been promoted to Marketing Director in a leading car rental company: congratulations! You have inherited a sizable eight figure budget: how should you best use this money to grow your direct sales whilst improving your post-marketing contribution?
For me, a good place to start is understanding where you stand in the market, who are the competitors, how do customers find their way to the websites which constitute your market.
SimilarWeb is a great tool to provide estimated traffic metrics and sources for any website in any market. It is a good place to start to understand the relative sizes of your competitors, as well as the main channels that they get the most success from.

The above is a very typical output for digital businesses in 2020 with search dominating channel performance. Search accounts for almost 77% of the traffic, so more than 3 out of 4 visits come from search. Just today I have undertaken 21 separate Google searches and it’s not even lunchtime. It’s really no surprise therefore, that globally there are on average 3.5bn searches run everyday.
Search: the most important traffic source for merchant websites
After working for a number of companies in different verticals, I have found out that the example above represents the large majority of merchant websites, and has therefore become one of my main areas of focus in starting out with a new company.
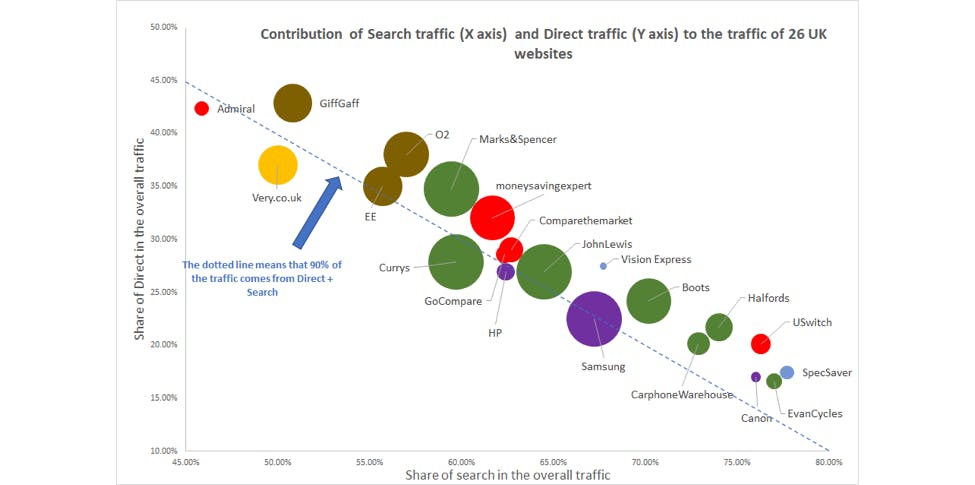
The following chart further illustrates the point. I have analysed 26 well known UK websites, all operating in different product categories.

The chart above shows that more than 90% of website traffic from these brands comes from either direct or search, with the share of search representing between 55% and 75% of all traffic. Even knowing the proportion of direct traffic can provide essential signals in understanding the strength of a company’s (or competitor’s) brand.
The additional great news is that search is a gold mine of insight for marketing strategy, especially as search data has two very desirable properties: it is publicly available and very granular, detailing an analysis of actual customer behaviour.
The market footprint: is the market skewed towards brand, generic and/or local?
Over the last ten years, search has therefore been my go-to when starting in a new role, enabling me to design appropriate strategies every single time: turning what is considered as a technical optimization dataset into strategic insights to build a marketing roadmap.
For example, when I was working for Hertz (2012-2014), the key learning was that 60% of the searches in the market were brand terms. At least the top 10 terms were Hertz, Enterprise, Avis, Europcar etc., each significantly bigger than “car hire” or “car rental”
The map highlighted that organic search had a much bigger potential. As a consequence, I turned the marketing mix upside-down, financing a reinvestment on brand and an ambitious SEO program by reducing generic paid-search.
And it worked spectacularly well, multiplying the SEO traffic by 4 in 2 years, whilst reducing the overall marketing spend by 25%.
Recently, advising one company in the driving lessons industry, I could demonstrate that they had a significant potential to grow their local search visibility. This is not rocket science as it is very logical for pupils to look for driver instructors close to their homes.
With most of the traffic being driven by either brand or local, developing pages and improving local search was a much cheaper and bigger opportunity than, for instance, generic paid-search.

Identifying the main channels and investing the spend and resources on the right priorities is critical to deliver a successful marketing strategy.
On the other hand, in an industry such as financial investment, the mix between brand terms and generic terms is more than 80% for brand with generic playing a very marginal role. The focus will therefore be on the proposition and the communication to the target audiences via social media and above-the-line.

Building a detailed roadmap based on search
Let’s move from car hire and driving schools to price comparison, a very competitive and mature market with millions of pounds going into marketing every year. It is also a complicated market with most competitors being positioned across a variety of products from mortgages to car insurance, including mobile plans, broadband and utilities comparison.
Here we can use the granularity of the data to quantify:
- how large each category is,
- which players are stronger on which products,
- what will be the ratio effort/results to grow in the different verticals,
- and what topics make up the search universe to guide the efforts in both organic and paid-search.

The picture above captures the essence of the price comparison market as it shows:
- the size of the different players,
- their relative distance in terms topics they are competing on,
- the clusters reflecting their respective level of competition,
- and the topic dominating the different clusters.
We can see the different footprints of each player, with confused.com and gocompare being strongly in the insurance business, whilst Uswitch is primarily in broadband, but with strong links as well with the energy, mobile and assurance markets.

The visualisation above is another representation of the data, but focusing on the top 5 price comparison websites.
It shows that five main products account for 80% of product related searches: car insurance, money products (mortgages, loans, credit cards), broadband, mobile phones and travel insurance.
For each player, understanding where they have opportunities to grow and sizing the opportunity becomes a very useful tool to decide where to focus and prioritise resources and budget.
Once the strategy is defined, the data can be mined further to create operational level guidance to plan how much input is required across brand, content, outreach, PR and technical SEO to gain share in a particular category.
Providing a continuous solution between strategic decision making and implementation has also been key to maintaining top level buy-in and support.
Conclusion
This presentation details the actual process I have developed in roles as Marketing Director, and has always delivered very strong results in marketing performance.
The combination of the power of the search data and its translations into business visualisations to engage beyond the marketing team has proven a winning formula to gain buy-in and pace even in complex organisations.
In my experience, getting trust in marketing relies on three main pillars:
- Articulate an effective strategy based on a good understanding of both the market and the strengths and weaknesses of your business. I designed this process ten years ago and have continued to refine and evolve the process as the data sets evolve.
- Getting traction and buy-in with your C-suite colleagues by converting marketing jargon into compelling visualisation: I have had great success with both pictures to get the attention of busy CEOs.
- Executing at pace by applying the same logic at operational level: when 91% of all content pieces fail to get traction, knowing which categories to target and use a scientific approach to cover all the semantic variations will deliver an excellent return on investment
This approach also provides an actional roadmap for both organic search and paid search, but this could be the topic for another post.
")

