by Adam Noar


Do you hate the time-consuming nature of creating fancy graphs and charts in PowerPoint?
If so, I’ve got a simple solution that can help.
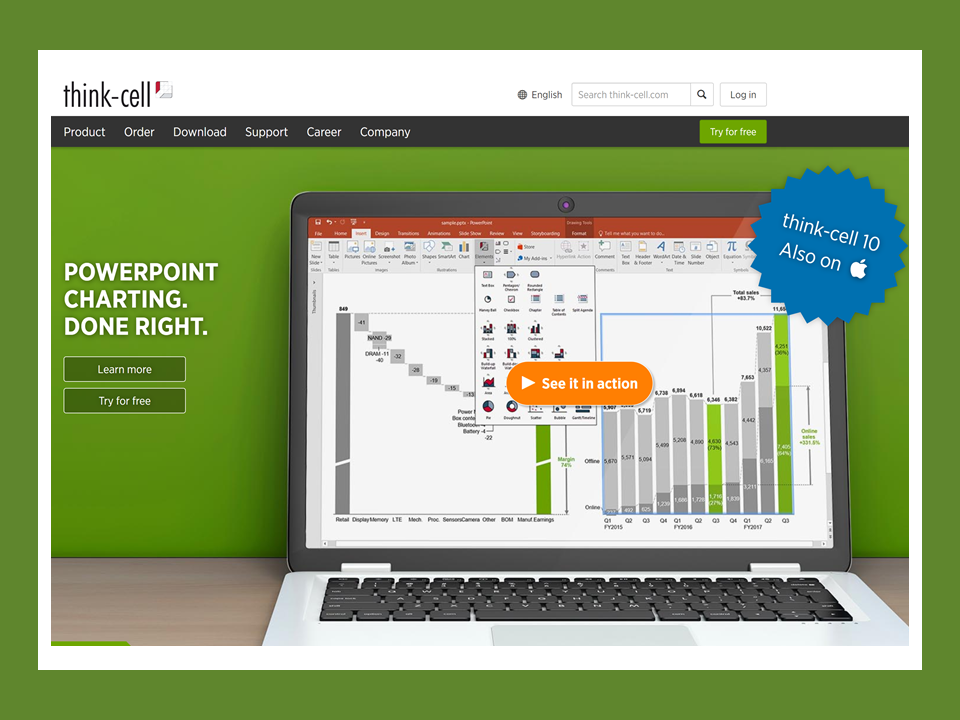
Introducing Think-Cell: a game-changing PowerPoint add-in tool for QUICKLY creating amazing charts.
Leading consulting firms use Think-Cell because it saves 70% of their time when working on charts.
In this post, we will give an overview of what Think-Cell does and the different type of charts you can create.
Let’s begin!
What is Think-Cell for PowerPoint?
Before I get into the details, check out this 2-minute overview video that explains what Think-Cell does:
Think-Cell is a powerful PowerPoint add-in tool that helps you create effective charting simply and quickly. It addresses the typical PowerPoint charting pain points like modifying elements, having easy access to elements, using arrows and many more such features.
The process of creating Think-Cell charts is not that different from creating charts in PowerPoint. In fact, the underlying datasheet is Excel, and when you select the data or edit the data you will be working on the underlying spreadsheet. So, as long as you know how to use Excel you will find using Think-Cell a breeze.
In addition to creating charts quickly, several frequently used chart types and elements that are missing in PowerPoint are covered by Think-Cell.
Let’s look at some of the Think-Cell charts, that are not present in PowerPoint, that help speed up chart production and save time.
1.) Gantt/Timeline Charts – (Not included in PowerPoint)

Think-Cell is the only software that allows you to create complex timeline charts (also known as Gantt charts) directly in PowerPoint.
What do you do when you need to quickly create a timeline slide for your client or boss?
Well, you could spend time in PowerPoint creating the timeline using tables and shapes. We do this all the time for clients and they look great. However, we can create fancy slides in a fraction of the time since we know PowerPoint inside and out.
Let’s look at a quick video demo that shows how quickly you can create a Gantt chart with Think-Cell:
Even if you are a savvy Panda, timeline slides can be designed even quicker and with 100% accuracy using Think-Cell.
2.) Mekko Chart (Not included in PowerPoint)

A Mekko chart (also known as Marimekko chart) is a two-dimensional 100% chart, in which the width of a column is proportional to the total of the column’s values. Data input is similar to a 100% chart, with data represented as either absolute values or percentages of a given total. Oh, you getting fancy now!
A Mekko chart is quite similar to a stacked chart. The only difference is that a Mekko Chart has varying column widths.
Creating a Mekko chart manually can take a lot of time.
It is not available in Microsoft PowerPoint, which makes it even more complicated to develop without Think-Cell.
Let’s look at a quick video demo that shows how quickly you can create a Mekko chart with Think-Cell:
https://www.youtube.com/watch?v= 3H5XgFD5WYQ
2.) Other Charts You Can Create with Think-Cell

Think-cell smoothly integrates into PowerPoint and brings you 40+ chart types, dozens of data-driven visual enhancements and other unique features
Beyond the exclusive Think-Cell charts that we talked about above (that are not included in PowerPoint) there are many types of charts that you can create with Think-Cell including:
Stacked column and bar chart – Stacked charts seem simple, but labeling, axes breaks and additional decorations can still take a lot of time.
Waterfall chart – To create a waterfall chart, simply enter the values to add. Positive values build up, negative values build down. “e” calculates a subtotal. For additional flexibility, you can interactively reattach the reference connector of each segment to change the order of summation.
Scatter and bubble chart – With think-cell you can forget about labeling scatter and bubble charts by hand. This is done automatically – even with two independent labels per scatter point or bubble.
Pie and doughnut chart – You can rotate and explode pie segments by simply dragging their handles to anchor points at 0, 90, 180 or 270 degrees. You can also create break-out charts with the help of universal connectors.
Line chart – Quickly create lines charts and play with advanced options such as a secondary value axis, interpolation, error bars and date-based axis formatting. And of course, you can combine line series with segment series to create combination charts.
Butterfly chart – You can flip most charts to combine them. Two charts can be adjusted to the same scale automatically. It also shows that all labels have the same functionality as PowerPoint textboxes.
Clustered chart – Clustered charts in think-cell feature the same advanced options as stacked column and bar charts. Arrows can be added that are calculated automatically and emphasize important relationships.
100% chart – The think-cell datasheet is a full-featured Excel sheet. You can input either absolute values or percentages. To quickly mark elements of the same type, you can use our intelligent logical selection mechanism.
Area chart – Create area charts and use advanced options such as the date-based category axis, the customization of value axis tickmarks, axis range, grid lines and bordered plot area.
Conclusion:
Creating slides in PowerPoint can be painstaking. Frequently used chart types and graphical elements are missing and there is nearly no automatic placement. Usually, you end up manually updating numbers and pushing around shapes. think-cell is different. It is a powerful charting and layout software that automates your PowerPoint work and such improves slide creation efficiency and quality. Within minutes you get well-laid-out and great-looking slides.
Do you think you will give Think-Cell a try? Why or why not? Sound off in the comments below!
Hungry for more info on how to create fancy charts in PowerPoint? Check out these articles:
5 Clever Ways to Present Data Effectively in PowerPoint (With Awesome Examples)
10 Examples of Charts that Don’t Suck

Looking For Powerpoint Design Agency?
Call Pursho @ 0731-6725516
Telegram Group One Must Follow :
For Startups: https://t.me/daily_business_reads
#Create #PowerPoint #Charts #Fast #ThinkCell #AddIn

