Currently, you can generate reliable data from anywhere, provided that you have the right strategy. Given that multiple data visualization tools exist, it’s difficult for a newbie to make the right decision. However, the human brain remains to be more receptive when it comes to consuming visual content compared to anything else. If you can adapt this fact, you will be in a better position to transform your data into a graphic format.
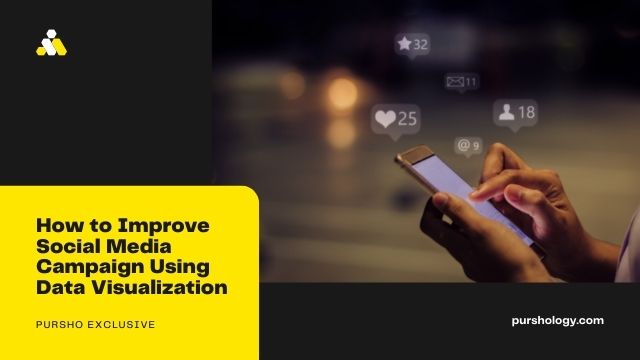
The rise of different social media has dramatically contributed to information overload. Business owners generate massive amounts of data from their daily operations across different social media platforms. According to statistics, the average daily spent on various social media platforms is 2 hours 27 minutes. Many people access different social platforms daily to conduct different activities.

However, the truth is that information overload will likely become a blessing or a curse depending on how you perceive it. When you generate massive amounts of data from your social media operations, you need to consider big data visualization to help you generate insights. Also, you can improve your social media campaign using data visualization, which is a crucial aspect of any business operating on any social media platform.
It’s easier to translate your social media data into an easily readable format that you can display to your team members and the entire market audience. However, many people get confused when they hear social media data since it sounds like a new concept. Here is exactly what you need to learn and master about social media data.
What is Social Media Data?
Many people firmly believe that social media is about shares, likes, and comments. However, this is just a puzzle; you need to learn more about many things behind the curtains. Social media gives you room to understand more about your target audience and how they interact with your business brand daily. If you understand your social media data well, you stand a better chance of gaining more insights into your business campaigns.
In addition, social media analytics enables you to generate more insights by helping you understand the best social media platforms that generate a higher conversion rate and the most leads for your business. Apart from the likes, shares, and comments, many things need to be measured using social media analytics. Below are some of the things you need to learn more about!
- Content Engagement
Social Media analytics enables you to identify the social media platforms where you need to publish more content and the places where you need to have less engagement.
- Sales Outreach
When creating modes which you can use to approach your audience and personalizing conversations. Once you have identified the best approach to use, enhancing your sales outreach activities becomes easier.
- Lead Generation
Analytics helps you to create a fantastic lead generation model, especially within your audience activities. Remember that good lead generation is vital for the success of your business efforts.
- Audience Segmentation
Your audience has different likes and dislikes that you need to handle. To handle all your customer’s needs, you need to segment your audience depending on different parameters and demographics.
Data Visualization for Social Media
Visualizing your social media campaigns entails many things you need to learn. Let’s check them out!
- LinkedIn Analytics
LinkedIn analytics enables you to analyze all the engagement that takes place within your LinkedIn page. When visualizing your campaigns on LinkedIn, you need to monitor various aspects to get better insights that will help you predict the way forward. The visitors’ dashboard enables you to get an overview of the page visitors. It allows you to evaluate how the metrics increase or decrease over a certain period.
Also, you need to closely monitor the traffic section, which displays the traffic stats over a particular period. Also, it gives you access to more metrics, such as the number of page views and unique visitors. You can also visualize more about the people who view your company page based on their demographics. Note that you can filter your search model depending on location, company size, industry, and seniority.
- Twitter Analytics
Twitter has a lot of potential, provided that you have the right trick to visualize the data you generate from the platform. There are various instances that you need to shed light on. You need to monitor your audience keenly to identify their interests and preferences. Also, this can help you learn more about some of the users who engaged with your tweets.
Visualizing your demographics will also give you an overview of your target audience based on their respective location, gender, and net worth. Big data visualization enables you to evaluate the impressions in your Twitter account. This gives you room to trace the existing patterns and the call to action to ensure that you are operating on the right track. Also, you can get a clear picture of the best time of the day to get more reactions.
- Facebook Insights
Facebook Insights enables you to visualize stats across your Facebook page. When running a social media campaign, you cannot neglect the power of Facebook since it’s one of the largest social platforms that give you a lot of exposure to potential customers. However, to get the best out of your social media page, you need to visualize various aspects to collect insights that will help you ensure you are operating on the right track.
Analyzing the post reach enables you to connect posts to different graph trends. Once you realize a dramatic increase in your page activity, you can use this data to identify the post that generates a lot of engagement. This mode of data visualization will enable you to create content posts that reciprocate your market audience. You need to visualize your page to be able to track all your followers. This will enable you to identify where most of your traffic comes from.
In addition, you need to consider the page views to determine the number of eyeballs that hit your Facebook page and the specific point where they are coming from. Besides, the page views are mainly made of a couple of categories: external referrals and tab visits. The external referrals are mainly the eyeballs referred to your page from other platforms. On the other hand, the tab visits are the number of eyeballs that land on your page.
Visualizing the posts operates based on different metrics that enable you to identify if the content resonates with your page or not. As a result, this will enable you to identify some of the best times you can publish on your Facebook page and get better results. Also, consider the people tags on your page to help segment your market audience. This helps you when you want to pinpoint your fans based on different categories.
- Instagram Insights
Instagram is one of the most popular social media platforms where you can access multiple insights to help propel your business in the right direction. The only thing you need to master is how to visualize the data you generate from the platform and use it to identify the best way possible. Big data visualization enables you to evaluate your respective target market’s gender and age range.
When you realize that your audience is full of older people, you need to consider posting things likely to intrigue the older generation. In addition, you will be able to identify your market audience’s location, enabling you to schedule a content strategy that works well for your audience. Stories and analytics are other incredible features that help you learn how your audience interacts with the content you post.
Consider the video engagement rate by analyzing the number of people who have viewed the videos you post and their reactions. Remember that the essential aspect to consider is the audience retention time to identify how long you have been able to retain the attention of those who viewed the videos you published on your Instagram page. This will give you a clear idea of what needs to be done to ensure that your business thrives regardless of the headwinds within the industry.
Final Verdict
The report published in 2021 revealed that social media has 3.78 billion active users across the globe. Using the third eye, you can easily upgrade your social media campaign by looking at the data you generate from your business operations. The good news to smile about is that most social media platforms have analytics dashboards where you can collect enough data to help you identify the best way going forward. All you need to do is ensure that data visualization remains the puzzle across all your social media campaigns.
")

