Most SaaS companies are familiar with traditional SaaS metrics, like CAC (customer acquisition cost) payback, LTV (lifetime value), and average ACV (annual contract value). These metrics have value, for sure, but they don’t always paint a complete picture for product-led growth (PLG) software companies.
For example, traditional, sales-led growth (SLG) software companies chase high growth rates from the get-go. PLG SaaS companies tend to have lower growth rates in the beginning. But data shows that this is only true until the company reaches the $10M ARR (annual recurring revenue) mark. After that point, growth skyrockets. A PLG SaaS company’s funnel and customer usage behaviors also differ dramatically from SLG companies. This all affects which metrics you need to measure to assess the company’s performance.
I previously led Sales and Customer Success at a residential real estate marketplace, where our go-to-market combined both product-led (consumer customers) and sales-led (SMB customers) growth motions. This hybrid approach added to the complexity and breadth of the metrics we needed to track and focus on moving. There wasn’t nearly as much written about product-led metrics, so we had to use trial and error to get things right.
My cofounders and I have taken these learnings and applied them to our growth approach at AirOps. Here are some of the exact SaaS business metrics we look to measure, monitor, and move forward.
-
Natural rate of growth
-
Burn multiple
-
Activation velocity (at 48 hours)
-
New user churn rate
-
Expansion revenue
PLG vs. SLG: What is product-led growth and how does it differ from sales-led growth?
The primary differences boil down to sequencing and sales-team involvement:
-
Product-led growth companies employ a self-service model, where customers can create an account, learn the product, and dive right in with no or limited contact with a sales team. Canva, Calendly, and Shopify are all examples of PLG organizations.
-
Sales-led growth companies rely on 1-on-1 sales assistance to guide potential customers through every stage of the customer onboarding journey. Salesforce and GoGuardian are examples of SLG organizations.
It’s also not uncommon for companies to combine both approaches; this hybrid model is gaining popularity across industries. For a more in-depth look at what the PLG/SLG hybrid approach can look like in a company, this resource from Paddle is a great one: PLG + SLG: Maximize your business growth with a hybrid GTM strategy.
Executive-level PLG SaaS metrics
Executives—and investors—are most interested in metrics that tie directly to growth (typically revenue) and unit economics/profitability.
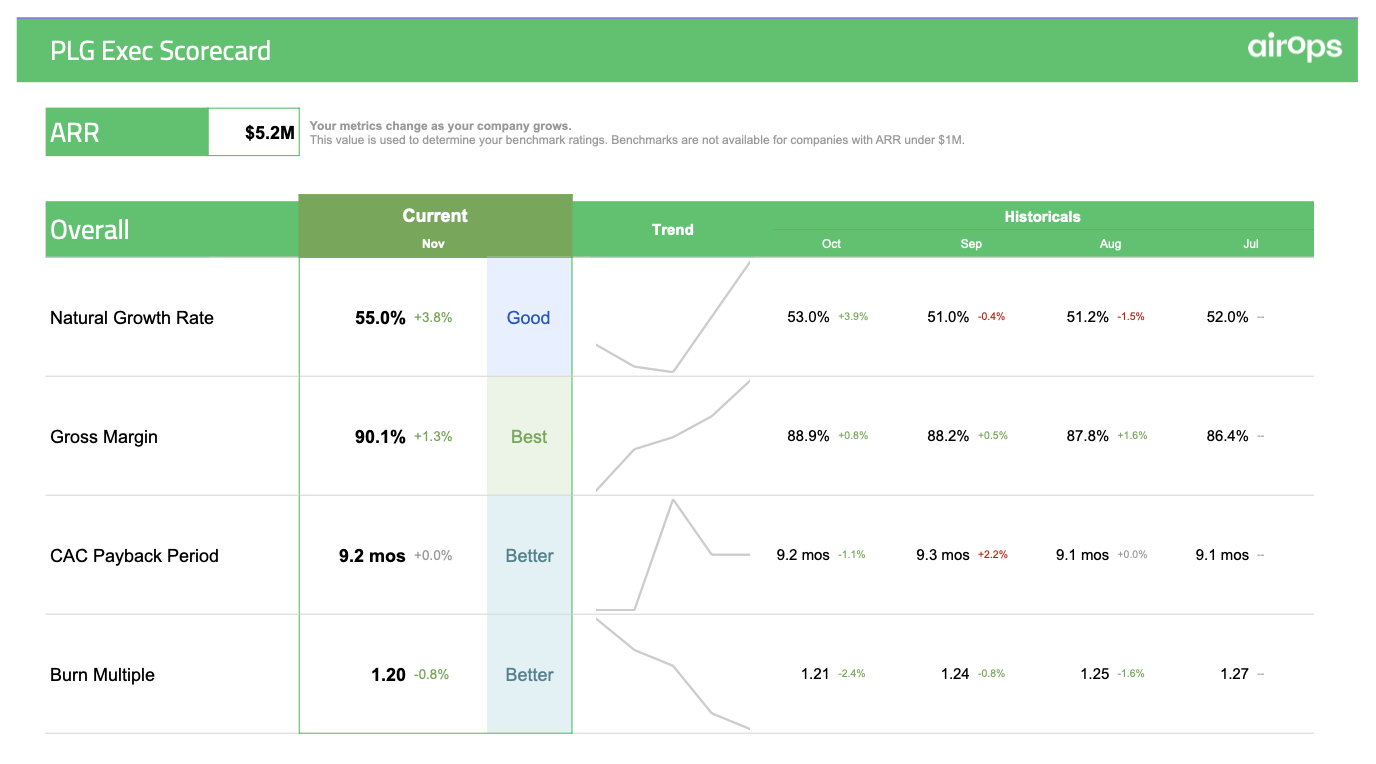
At AirOps, we use this PLG scorecard to easily track executive-level metrics (and operations-related metrics, too—I’ll share a screenshot of that view below). This template lives in Google Sheets and updates automatically through AirOps, which makes tracking these critical data points easier.
1. Natural rate of growth (NRG)
Natural Rate of Growth (NRG) measures how quickly a company would grow without any effort—in the form of marketing and sales—or outside investments. Essentially, NRG allows PLG companies to determine what percentage of their recurring revenue comes from organic channels and begins with the product. Here’s the calculation:
Natural Rate of Growth = 100 x Annual Growth Rate x Organic Signups (%) x ARR from Products (%)
NRG is a valuable metric for product-led SaaS companies because it measures growth potential and helps organizations set realistic growth goals and track their progress over time.
2. Burn multiple
Burn multiple measures the efficiency and sustainability of a company’s growth model—it’s your net cash burned divided by your net new ARR in a given period. It’s a fantastic complement to growth metrics like NRG because it contextualizes growth as a function of investment.
Burn Multiple = Cash Burned / New ARR (Annual Recurring Revenue)
Because it’s a measure of your company’s capital efficiency, you generally want to keep it as low as possible. But keep in mind that burn multiple is highly sensitive to a company’s size and stage. For example, an early-stage company attempting to find product-market fit will likely have a higher burn multiple in the beginning.
Operational PLG SaaS metrics
Things start to get more granular at the operational level—as you can see in the PLG ops scorecard below, there are a lot of potential operations-related metrics to track.
For this intro to the great big world of PLG SaaS metrics, I’ll focus on three that I find particularly useful: activation velocity (at 48 hours), new user churn rate, and expansion revenue.
3. Activation velocity (at 48 hours)
I love this metric because it measures the speed and efficiency of a company’s onboarding and activation experience. Activation velocity is a curve that shows how (and when) users reach a key onboarding milestone: activation.
Activation looks different for every PLG SaaS company, so it’s important to define what it means to your organization. At AirOps, we count a user as activated when they set up a sync from their data warehouse to an operating document, like a Google Sheet, Airtable base, or Notion database. At a company like Zapier, activation would be a user turning on their first Zap.
Zapier is the leader in no-code automation—integrating with 5,000+ apps from partners like Google, Salesforce, and Microsoft. Build secure, automated systems for your business-critical workflows across your organization’s technology stack. Learn more.
The calculation is pretty straightforward:
Activation Velocity = % of leads activated 48 hours after account creation
Why 48 hours? I like to use this timeframe because it demonstrates how effective and efficient the user onboarding experience is. You can use other milestones, though, depending on your company.
One of the most effective ways to use this metric is to plot activation rates versus time. This will help you see if there are any hurdles to activation and where the onboarding/activation process needs some tweaks (which is another reason I like to use 48 hours as the time period).
4. New user churn rate
Customer churn is a valuable metric, but I also like to include new user churn rate in my PLG metrics framework. This data point helps you see the percentage of users who churn within 30 days of being activated.
Use this calculation to measure new user churn rate:
New User Churn Rate = Users churned within 30 days of activation / All new activated users from the last 30 days
Not surprisingly, high levels of new user churn within the first month of activation is often a function of poor onboarding. However, churn is also normal and unavoidable. If your new user churn rate is higher than you’d like, the best thing to do is discover the root cause. A poor onboarding experience, lackluster customer support, and product complexity can all lead to increased new user churn.
5. Expansion revenue
Expansion revenue refers to additional revenue generated from a customer after their initial purchase. Some PLG SaaS companies like to measure this metric in terms of monthly recurring revenue (MRR), but you can choose any timeframe that makes sense for your organization. I like to measure expansion revenue as it relates to annual recurring revenue (ARR).
The formula is a simple one:
Expansion Revenue = ARR from cross-sells + ARR from upsells
Expansion revenue is generated from cross-sells and upsells, like a customer purchasing additional features or upgrading to a higher-priced plan as their need for your product increases.
I like this metric because it measures how effectively your company can generate revenue from customers that already know and love your brand—which is far more cost-effective than acquiring new customers. If you want to increase expansion revenue, it’s essential to:
-
Understand exactly why your customers find your product valuable
-
Understand your customer journey and how customers react at different stages of that journey
-
Develop features that complement your core offering
-
Make the upgrading experience frictionless
Tips for measuring key SaaS metrics for PLG companies
Regardless of the metrics that you use to track the performance of a PLG SaaS company, the following data-related best practices should remain top of mind.
You can’t (and shouldn’t) measure everything
A PLG SaaS company’s metrics framework might include all five metrics on this list or only a few. It all depends on the organization’s North Star goals: the most important, mission-critical outcomes the business hopes to achieve. Traditionally, North Star goals link to revenue and financial performance. For product-led companies, this may not always be the case.
For example, an early-stage SaaS startup in its pre-monetization phase will benefit from focusing on metrics that speak to acquisition (e.g., product qualified leads, cost per lead) and activation (e.g., activation velocity, activation rate).
Product quality is paramount
In product-led companies, quality is the most critical factor. Every single outcome metric (those North Star goals I mentioned above) relies on the quality of your product, your customer support, and so on.
You need to understand the “why” behind the data
Measuring the right PLG Saas metrics isn’t enough. You also need to ask questions and get curious about the logic behind the numbers. It’s the only way to use data to fuel growth and improve decision-making.
For example, knowing that your organization has a high new user churn rate isn’t useful information in a vacuum. The metric is only valuable if you use it to uncover root causes and drive action.
Remember that a solid PLG SaaS foundation requires a solid data foundation
The most successful product-led businesses are also data-led businesses. From personalized onboarding experiences to retention optimization, winning PLG SaaS companies take a data-driven approach to decision-making.
I’d recommend a “crawl-walk-sprint” process when it comes to instrumenting, measuring, and then moving your key metrics for SaaS. Speaking from experience, this incremental approach will help you avoid common data-related mistakes. There’s a lot of nuance that goes into becoming a data-driven company, and it’s tough to make blanket recommendations, but here’s one example of a successful approach I’ve seen work well in companies we’ve consulted with at AirOps:
-
Crawl: Foster a data-driven culture, get buy-in from key stakeholders, and develop cross-functional partnerships with your sales, marketing, customer support, finance, and other teams that need data to make good decisions.
-
Walk: Develop your data strategy and metrics framework. In other words, determine your goals, which metrics are best suited to help you track progress toward those goals, and the type of data infrastructure you’ll need to measure everything. For that last part, most PLG SaaS companies that I work with opt for a modern data stack with a cloud data warehouse at the center.
-
Sprint: Now that you have buy-in, a plan, and the right tools and technology, it’s time to infuse data-driven insights into everyday decision-making. Your weekly leadership meetings are a great place to start—here’s how to make sure you get the data side of things right.
You (probably) won’t get everything right on the first try, but that’s the great thing about data—it’s all about testing, iterating, and learning what works and what doesn’t.
[adsanity_group align=’alignnone’ num_ads=1 num_columns=1 group_ids=’15192′]
Need Any Technology Assistance? Call Pursho @ 0731-6725516


