” India’s GDP Growth: 1960-2021 | Data Analysis Project discussion in Excel”
Dataset Link:
https://drive.google.com/file/d/1u7IhVVXOuM0V-UlfwWlstXTFwq7Jri3t/view?usp=sharing

Description:
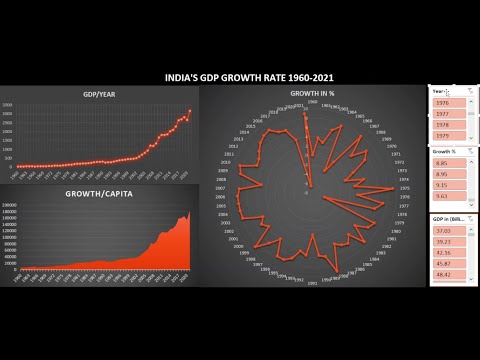
Welcome to our data analysis project where we dive deep into India’s GDP growth over six decades, from 1960 to 2021. In this insightful video, we’ll explore the historical trends, pivotal moments, and contributing factors that have shaped India’s economic landscape. Using Excel, we’ll walk you through the process of cleaning, visualizing, and interpreting the data, providing valuable insights into the nation’s economic journey. Whether you’re a student, researcher, or simply curious about India’s economic history, this video is packed with informative content to satisfy your curiosity. Join us on this data-driven exploration and enhance your data analysis skills along the way!
Tags:
India GDP growth, Data analysis, Excel tutorial, Economic trends, Historical data, Data visualization, India’s economy, GDP growth analysis, Excel data analysis, Economic history, Data interpretation, Excel tutorial for beginners, Data insights, Economic research, Excel data visualization, Data trends, Economic development, Excel data cleaning, Economic analysis, Data exploration, India’s GDP history, Economic factors, Economic impact, Excel tips and tricks
")

