Even with years of professional experience working with data, the term “data analysis” still sets off a panic button in my soul. And yes, when it comes to serious data analysis for your business, you’ll eventually want data scientists on your side. But if you’re just getting started, no panic attacks are required.

Before you dive in, though, make sure you and your team understand the basics. Here, I’ll break down the five types of data analysis, offer examples for each, and walk you through how to use your insights.
Table of contents:
Quick review: What is data analysis?
Data analysis is the process of examining, filtering, adapting, and modeling data to help solve problems. Data analysis helps determine what is and isn’t working, so you can make the changes needed to achieve your business goals.
Keep in mind that data analysis includes analyzing both quantitative data (e.g., profits and sales) and qualitative data (e.g., surveys and case studies) to paint the whole picture. Here are two simple examples (of a nuanced topic) to show you what I mean:
-
Quantitative data analysis example: An online jewelry store owner looks at their sales from the past six months and sees that, on average, they sold 210 gold pieces and 105 silver pieces per month, but they only had 100 gold pieces and 100 silver pieces in stock. By collecting and analyzing inventory data on these SKUs, they’re forecasting to improve reordering accuracy. The next time they order inventory, they order twice as many gold pieces as silver to meet customer demand.
-
Qualitative data analysis example: A fitness studio owner sends out an open-ended survey asking customers what types of exercises they enjoy the most. The owner then performs qualitative content analysis to identify the most frequently suggested exercises and incorporates these into future workout classes.
Types of data analysis (with examples)
There are five main types of data analysis—with increasingly scary-sounding names. Each one serves a different purpose, so take a look to see which makes the most sense for your situation. It’s ok if you can’t pronounce the one you choose.
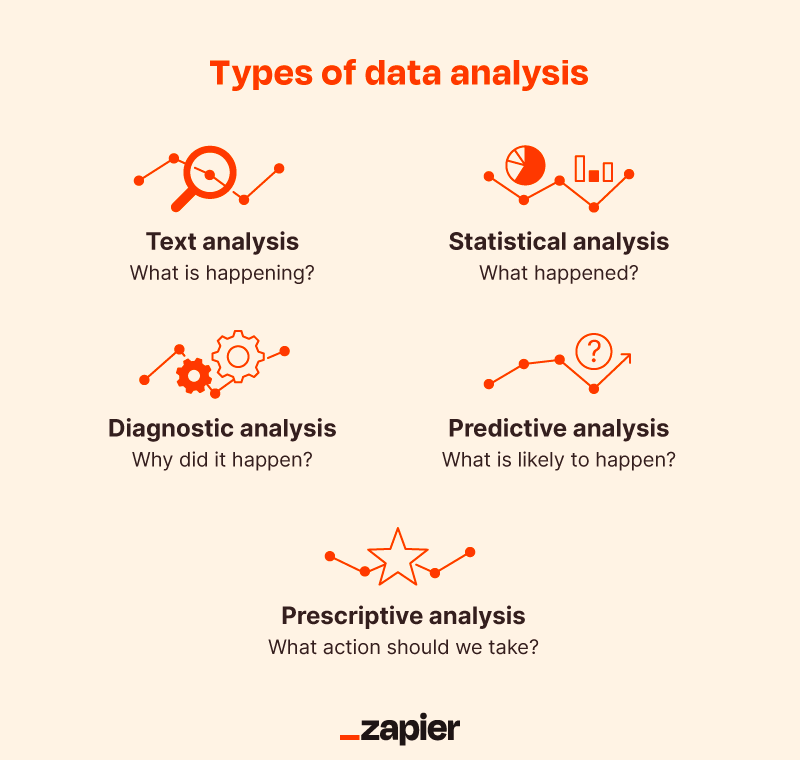
Text analysis: What is happening?
Text analysis, AKA data mining, involves pulling insights from large amounts of unstructured, text-based data sources: emails, social media, support tickets, reviews, and so on. You would use text analysis when the volume of data is too large to sift through manually.
Here are a few methods used to perform text analysis, to give you a sense of how it’s different from a human reading through the text:
-
Word frequency: Identifies the most frequently used words. For example, a restaurant monitors social media mentions and measures the frequency of positive and negative keywords like “delicious” or “expensive” to determine how customers feel about their experience.
-
Language detection: Indicates the language of text. For example, a global software company may use language detection on support tickets to connect customers with the appropriate agent.
-
Keyword extraction: Automatically identifies the most used terms. For example, instead of sifting through thousands of reviews, a popular brand uses a keyword extractor to summarize the words or phrases that are most relevant.
Because text analysis is based on words, not numbers, it’s a bit more subjective. Words can have multiple meanings, of course, and Gen Z makes things even tougher with constant coinage. Natural language processing (NPL) software will help you get the most accurate text analysis, but it’s rarely as objective as numerical analysis.
Statistical analysis: What happened?
Statistical analysis pulls past data to identify meaningful trends. There are two main types of statistical analysis: descriptive and inferential.
Descriptive analysis
Descriptive analysis looks at numerical data and calculations to determine what happened in a business. Companies use descriptive analysis to determine customer satisfaction, track campaigns, generate reports, and evaluate performance.
Here are a few methods used to perform descriptive analysis:
-
Measures of frequency: This method identifies how frequently an event occurs. For example, a popular coffee chain sends out a survey asking customers what their favorite holiday drink is and uses measures of frequency to determine how often a particular drink is selected.
-
Measures of central tendency: Here, you’d use mean, median, and mode to identify results. For example, a dating app company might use measures of central tendency to determine the average age of its users.
-
Measures of dispersion: Measures how data is distributed across a range. For example, HR may use measures of dispersion to determine what salary to offer in a given field.
Inferential analysis
Inferential analysis uses a sample of data to draw conclusions about a much larger population. This type of analysis is used when the population you’re interested in analyzing is very large.
Here are a few methods used when performing inferential analysis:
-
Hypothesis testing: Identifies which variables impact a particular topic. For example, a business uses hypothesis testing to determine if increased sales were the result of a specific marketing campaign.
-
Confidence intervals: Indicates how accurate an estimate is. For example, a company using market research to survey customers about a new product may want to determine how confident they are that the individuals surveyed make up their target market.
-
Regression analysis: Shows the effect of independent variables on a dependent variable. For example, a rental car company may use regression analysis to determine the relationship between wait times and number of bad reviews.
Diagnostic analysis: Why did it happen?
Diagnostic analysis, also referred to as root cause analysis, uncovers the causes of certain events or results.
Here are a few methods used to perform diagnostic analysis:
-
Time-series analysis: Analyzes data collected over a period of time. A retail store may use time-series analysis to determine that sales increase between October and December every year.
-
Data drilling: Uses business intelligence (BI) to show a more detailed view of data. For example, a business owner could use data drilling to see a detailed view of sales by state to determine if certain regions are driving increased sales.
-
Correlation analysis: Determines the strength of the relationship between variables. For example, a local ice cream shop may determine that as the temperature in the area rises, so do ice cream sales.
Predictive analysis: What is likely to happen?
Predictive analysis aims to anticipate future developments and events. By analyzing past data, companies can predict future scenarios and make strategic decisions.
Here are a few methods used to perform predictive analysis:
-
Machine learning: Uses AI and algorithms to predict outcomes. For example, search engines employ machine learning to recommend products to online shoppers that they are likely to buy based on their browsing history.
-
Decision trees: Maps out possible courses of action and outcomes. For example, a business may use a decision tree when deciding whether to downsize or expand.
Prescriptive analysis: What action should we take?
The highest level of analysis, prescriptive analysis, aims to identify the best course of action going forward. Typically, AI tools model different outcomes to predict the best approach. While these tools serve to provide insight, they don’t replace human consideration, so always use your human brain before going with the conclusion of your prescriptive analysis. Otherwise, your GPS might drive you into a lake.
Here are a few methods used to perform prescriptive analysis:
-
Lead scoring: Used in sales departments to assign values to leads based on their perceived interest. For example, a sales team uses lead scoring to rank leads on a scale of 1-100 depending on the actions they take (e.g., opening an email or downloading an eBook). They then prioritize the leads that are most likely to convert.
-
Algorithms: Used in technology to perform specific tasks. For example, banks use prescriptive algorithms to monitor customers’ spending and recommend that they deactivate their credit card if fraud is suspected.
Data analysis process: How to get started
The actual analysis is just one step in a much bigger process of using data to move your business forward. Here’s a quick look at all the steps you need to take to make sure you’re making informed decisions.
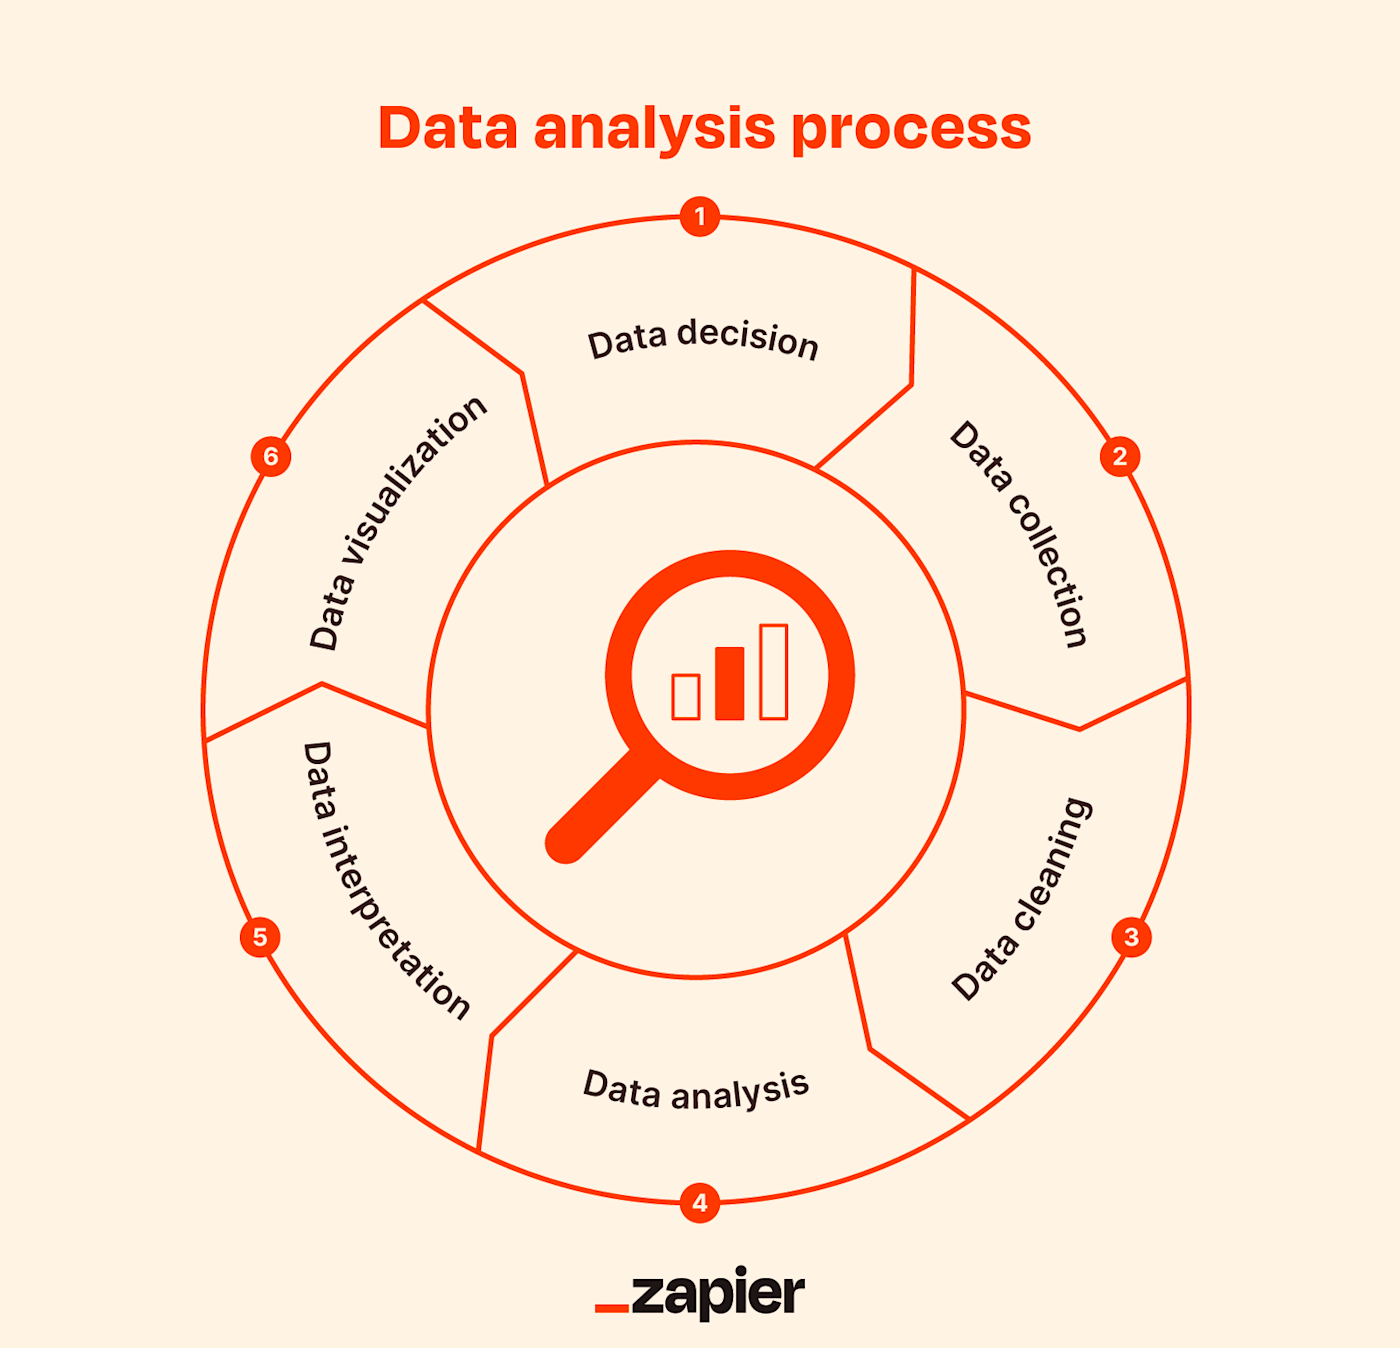
Data decision
As with almost any project, the first step is to determine what problem you’re trying to solve through data analysis.
Make sure you get specific here. For example, a food delivery service may want to understand why customers are canceling their subscriptions. But to enable the most effective data analysis, they should pose a more targeted question, such as “How can we reduce customer churn without raising costs?”
These questions will help you determine your KPIs and what type(s) of data analysis you’ll conduct, so spend time honing the question—otherwise your analysis won’t provide the actionable insights you want.
Data collection
Next, collect the required data from both internal and external sources.
-
Internal data comes from within your business (think CRM software, internal reports, and archives), and helps you understand your business and processes.
-
External data originates from outside of the company (surveys, questionnaires, public data) and helps you understand your industry and your customers.
You’ll rely heavily on software for this part of the process. Your analytics or business dashboard tool, along with reports from any other internal tools like CRMs, will give you the internal data. For external data, you’ll use survey apps and other data collection tools to get the information you need.
Data cleaning
Data can be seriously misleading if it’s not clean. So before you analyze, make sure you review the data you collected. Depending on the type of data you have, cleanup will look different, but it might include:
-
Removing unnecessary information
-
Addressing structural errors like misspellings
-
Deleting duplicates
-
Trimming whitespace
-
Human checking for accuracy
You can use your spreadsheet’s cleanup suggestions to quickly and effectively clean data, but a human review is always important.
Data analysis
Now that you’ve compiled and cleaned the data, use one or more of the above types of data analysis to find relationships, patterns, and trends.
Data analysis tools can speed up the data analysis process and remove the risk of inevitable human error. Here are some examples.
-
Spreadsheets: Sort, filter, analyze, and visualize data.
-
Business intelligence platforms: Model data and create dashboards.
-
Structured query language (SQL) tools: Manage and extract data in relational databases.
Data interpretation
After you analyze the data, you’ll need to go back to the original question you posed and draw conclusions from your findings. Here are some common pitfalls to avoid:
-
Correlation vs. causation: Just because two variables are associated doesn’t mean they’re necessarily related or dependent on one another.
-
Confirmation bias: This occurs when you interpret data in a way that confirms your own preconceived notions. To avoid this, have multiple people interpret the data.
-
Small sample size: If your sample size is too small or doesn’t represent the demographics of your customers, you may get misleading results. If you run into this, consider widening your sample size to give you a more accurate representation.
Data visualization
Last but not least, visualizing the data in the form of graphs, maps, reports, charts, and dashboards can help you explain your findings to decision-makers and stakeholders. While it’s not absolutely necessary, it will help tell the story of your data in a way that everyone in the business can understand and make decisions based on.
Automate your data collection
Data doesn’t live in one place. To make sure data is where it needs to be—and isn’t duplicative or conflicting—make sure all your apps talk to each other. Zapier automates the process of moving data from one place to another, so you can focus on the work that matters to move your business forward.
Related reading:
Need Any Technology Assistance? Call Pursho @ 0731-6725516

")
