Google recently announced “Core Web Vitals,” which are new performance metrics that will become a search ranking signal next year.
From the announcement:
Earlier this month, the Chrome team announced Core Web Vitals, a set of metrics related to speed, responsiveness and visual stability, to help site owners measure user experience on the web.
Today, we’re building on this work and providing an early look at an upcoming Search ranking change that incorporates these page experience metrics. We will introduce a new signal that combines Core Web Vitals with our existing signals for page experience to provide a holistic picture of the quality of a user’s experience on a web page.
Core Web Vitals consist of three new metrics:
- First Input Delay measures how fast users can interact with the page; a good value is less than 100 ms.
- Cumulative Layout Shift measures the visual stability of the page content; a good value is less than 0.1 seconds. Some pages move content when users take action, which can be frustrating.
You can quickly check these metrics on your site by installing “Web Vitals,” a third-party Chrome extension.
Google displays the new metrics in Search Console, PageSpeed Insights, and the Chrome User Experience Report.
Changes in Lighthouse 6.0
PageSpeed Insights is powered by an open-source tool from Google called Lighthouse, which was updated to support the new metrics, among other changes.
From the release notes, which appear below with slight clarifications, we learn that Google removed three metrics from the score calculation and reduce the weight of a couple of others.
TTI’s [Time to Interactive’s] weight has been reduced from 33% to 15%. This was in response to user feedback about TTI variability, as well as inconsistencies in metric optimizations. TTI is still a useful signal for when a page is fully interactive, however with TBT [Total Blocking Time] as a complement, variability is reduced. With this scoring change, we hope developers are more effectively encouraged to optimize for user interactivity.
FCP’s [First Contentful Paint’s] weight has been reduced from 23% to 15%. Measuring only when the first pixel is painted didn’t give us a complete picture. Combining it with measuring when users can see what they most likely care about (Largest Contentful Paint) better reflects the loading experience.
Max Potential FID [First Input Delay] has been deprecated. It is no longer shown in the report but is still available in the JSON. It is now recommended to look at TBT to quantify your interactivity instead of Max Potential FID.
First Meaningful Paint has been deprecated. This metric was too variant and had no viable path to standardization as the implementation is specific to Chrome rendering internals. While some teams do find the FMP timing to be worthwhile on their site, the metric will not receive additional improvements.
First CPU Idle has been deprecated because it’s not distinct enough from TTI. Total Blocking Time and Time to Interactive are the go-to metrics for interactivity now.
Cumulative Layout Shift’s weight is relatively low, though we expect to increase it in a future major version.
Google states that the new methodology will result in Lighthouse scores to (i) worsen by at least five points for 50 percent of all worldwide sites, (ii) remain unchanged for 30 percent of sites, and (iii) be “noticeably higher” for 20 percent.
Field Data vs. Lab Data
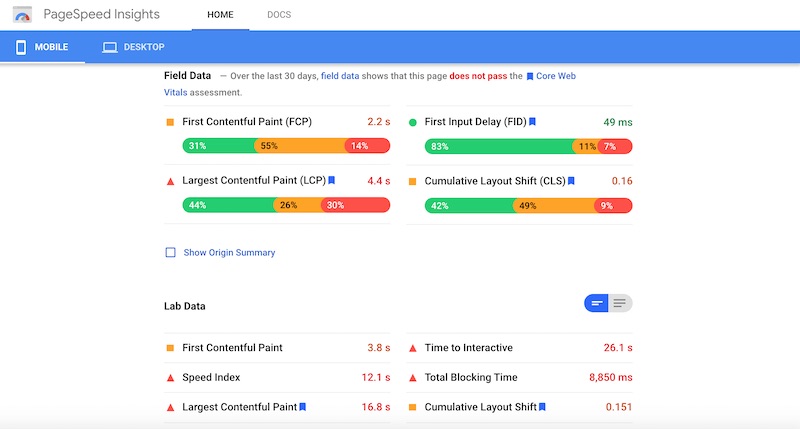
The new Core Web Vitals primarily focus on “Field Data” — data from real users. “Lab Data” is a simulation and doesn’t necessarily reflect real-life experience. PageSpeed Insights places Field Data above Lab Data, as shown in the screenshot below for a Shopify site, which does not, incidentally, pass the Core Web Vitals assessment.

PageSpeed Insights places “Field Data,” from real users, above the Lab Data, which is simulated.
Google recommends using Lab Data while a site is under development and Field Data when it’s live.
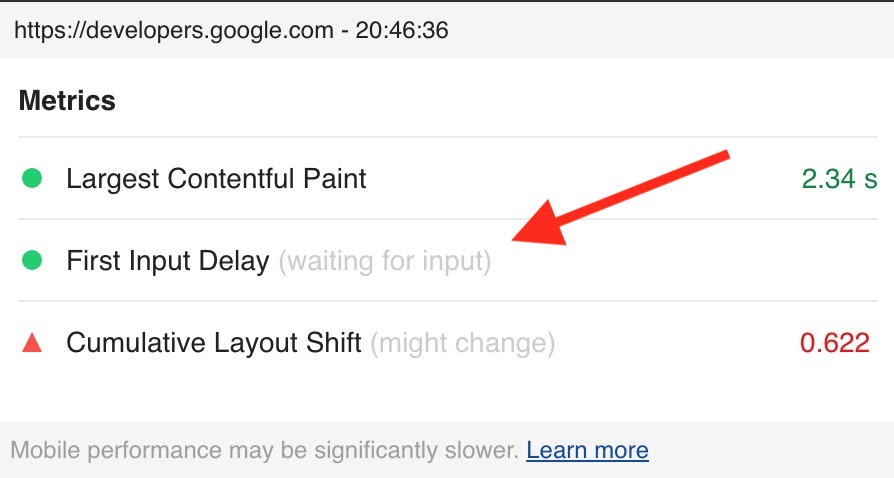
Here’s an example of how Field Data is collected from real interactions. The Web Vitals Chrome extension doesn’t initially display First Input Delay metrics, reporting in light gray, “waiting for input.” To get a value for your site, mouse over the main site navigation.

The Web Vitals Chrome extension doesn’t initially display First Input Delay metrics, reporting in light gray, “waiting for input.”
Updated Page Speed Study
“Page Speed Scores of Every Shopify Theme,” my article in April, included a table of those speeds at that time using PageSpeed Insights, which, again, was Lab Data.
What follows is an updated table of the page speed scores for mobile and desktop of all Shopify themes using Field Data. I’ve also included the Lab Data scores from April with the percent change for each theme.
The table, which is sortable by column, shows only the overall page speed score. For a detailed report of all Lighthouse metrics for each theme, see the Google Sheet.
| Theme | Mobile (June ’20) Page Speed Score |
Mobile (April ’20) Page Speed Score |
Mobile: % Change |
Desktop (June ’20) Page Speed Score |
Desktop (April ’20) Page Speed Score |
Desktop: % Change |
|---|---|---|---|---|---|---|
| Alchemy | 32 | 62 | -48.4% | 79 | 94 | -16.0% |
| Artisan | 30 | 61 | -50.8% | 77 | 97 | -20.6% |
| Atlantic | 62 | 68 | -8.8% | 86 | 99 | -13.1% |
| Avenue | 43 | 48 | -10.4% | 71 | 77 | -7.8% |
| Blockshop | 27 | 37 | -27.0% | 74 | 81 | -8.6% |
| Boost | 61 | 77 | -20.8% | 95 | 98 | -3.1% |
| Boundless | 70 | 88 | -20.5% | 91 | 97 | -6.2% |
| Broadcast | 36 | 34 | 5.9% | 74 | 77 | -3.9% |
| Brooklyn | 56 | 72 | -22.2% | 89 | 98 | -9.2% |
| California | 48 | 40 | 20.0% | 91 | 95 | -4.2% |
| Canopy | 45 | 50 | -10.0% | 93 | 97 | -4.1% |
| Capital | 37 | 81 | -54.3% | 88 | 98 | -10.2% |
| Cascade | 78 | 69 | 13.0% | 98 | 100 | -2.0% |
| Colors | 29 | 53 | -45.3% | 89 | 95 | -6.3% |
| Context | 20 | 37 | -45.9% | 67 | 79 | -15.2% |
| Debut | 79 | 88 | -10.2% | 97 | 99 | -2.0% |
| District | 71 | 83 | -14.5% | 94 | 94 | 0.0% |
| Editions | 45 | 63 | -28.6% | 90 | 97 | -7.2% |
| Editorial | 78 | 89 | -12.4% | 97 | 99 | -2.0% |
| Emerge | 37 | N/A | N/A | 79 | N/A | N/A |
| Empire | 61 | 68 | -10.3% | 90 | 99 | -9.1% |
| Envy | 18 | 31 | -41.9% | 79 | 81 | -2.5% |
| Express | 95 | N/A | N/A | 95 | N/A | N/A |
| Expression | 67 | 70 | -4.3% | 95 | 97 | -2.1% |
| Fashionopolism | 32 | 74 | -56.8% | 70 | 97 | -27.8% |
| Flow | 20 | 53 | -62.3% | 60 | 66 | -9.1% |
| Focal | 61 | 62 | -1.6% | 93 | 94 | -1.1% |
| Galleria | 37 | 30 | 23.3% | 69 | 78 | -11.5% |
| Grid | 34 | 72 | -52.8% | 88 | 97 | -9.3% |
| Handy | 27 | 40 | -32.5% | 82 | 85 | -3.5% |
| Icon | 28 | 36 | -22.2% | 84 | 93 | -9.7% |
| Impulse | 60 | 68 | -11.8% | 86 | 92 | -6.5% |
| Ira | 45 | 66 | -31.8% | 87 | 96 | -9.4% |
| Kagami | 43 | 66 | -34.8% | 91 | 97 | -6.2% |
| Kingdom | 49 | 78 | -37.2% | 97 | 98 | -1.0% |
| Label | 63 | 79 | -20.3% | 96 | 99 | -3.0% |
| Launch | 33 | 48 | -31.3% | 68 | 81 | -16.0% |
| Loft | 27 | 23 | 17.4% | 83 | 86 | -3.5% |
| Lorenza | 29 | 30 | -3.3% | 70 | 67 | 4.5% |
| Maker | 30 | 48 | -37.5% | 79 | 87 | -9.2% |
| Masonry | 46 | 57 | -19.3% | 90 | 88 | 2.3% |
| Minimal | 71 | 78 | -9.0% | 92 | 99 | -7.1% |
| Mobilia | 36 | 53 | -32.1% | 65 | 96 | -32.3% |
| Modular | 50 | 73 | -31.5% | 93 | 98 | -5.1% |
| Motion | 29 | 32 | -9.4% | 84 | 80 | 5.0% |
| Mr Parker | 32 | 40 | -20.0% | 80 | 95 | -15.8% |
| Narrative | 71 | 80 | -11.3% | 95 | 100 | -5.0% |
| Pacific | 23 | 34 | -32.4% | 73 | 81 | -9.9% |
| Palo Alto | 15 | 29 | -48.3% | 41 | 77 | -46.8% |
| Parallax | 35 | 31 | 12.9% | 79 | 82 | -3.7% |
| Pipeline | 52 | 54 | -3.7% | 95 | 93 | 2.2% |
| Prestige | 51 | 66 | -22.7% | 90 | 96 | -6.3% |
| Providence | 39 | 41 | -4.9% | 76 | 75 | 1.3% |
| Reach | 26 | 33 | -21.2% | 74 | 81 | -8.6% |
| Responsive | 29 | 49 | -40.8% | 75 | 93 | -19.4% |
| Retina | 17 | 8 | 112.5% | 57 | 58 | -1.7% |
| Showcase | 81 | 82 | -1.2% | 97 | 98 | -1.0% |
| ShowTime | 24 | 25 | -4.0% | 82 | 83 | -1.2% |
| Simple | 83 | 92 | -9.8% | 95 | 99 | -4.0% |
| Split | 64 | 68 | -5.9% | 82 | 92 | -10.9% |
| Startup | 37 | 43 | -14.0% | 89 | 86 | 3.5% |
| Story | 71 | 64 | 10.9% | 97 | 98 | -1.0% |
| Streamline | 38 | 79 | -51.9% | 91 | 99 | -8.1% |
| Sunrise | 62 | 70 | -11.4% | 90 | 99 | -9.1% |
| Supply | 75 | 86 | -12.8% | 94 | 99 | -5.1% |
| Symmetry | 37 | 67 | -44.8% | 93 | 98 | -5.1% |
| Testament | 55 | 55 | 0.0% | 86 | 94 | -8.5% |
| Trademark | 54 | 60 | -10.0% | 87 | 95 | -8.4% |
| Vantage | 47 | 64 | -26.6% | 80 | 90 | -11.1% |
| Venture | 88 | 85 | 3.5% | 93 | 99 | -6.1% |
| Venue | 20 | 33 | -39.4% | 72 | 81 | -11.1% |
| Vogue | 29 | 47 | -38.3% | 83 | 88 | -5.7% |
| Warehouse | 50 | 41 | 22.0% | 94 | 88 | 6.8% |


